Central Texas Commercial Real Estate Capital Markets Report: Buyers Are Back, But They’re Buying Differently
By Robert J. Fischer, CCIM, Broker Associate with the Robert J. Fischer Team at Keller Williams Realty — Data as of July 12, 2026
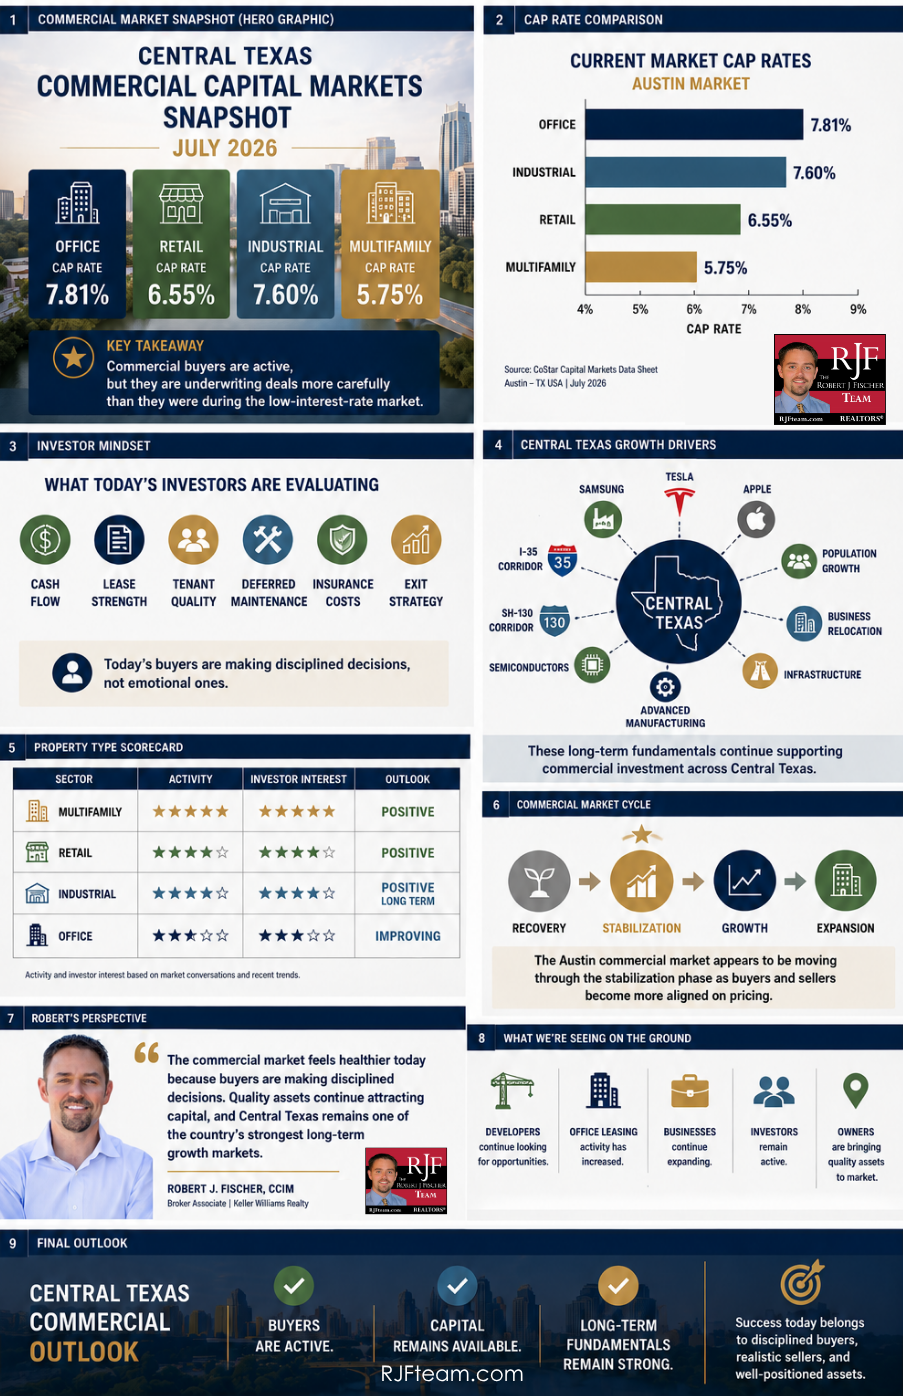
The latest CoStar Capital Markets data for the Austin market shows a commercial real estate market that continues to stabilize. While transaction activity remains below the record pace experienced during the low interest rate environment of 2021 and early 2022, today’s market tells a different story.
Investors remain active, developers continue evaluating new opportunities, businesses are still expanding throughout Central Texas, and leasing activity has picked up across several commercial sectors. The difference today is that decisions are being made more carefully. Buyers are placing greater emphasis on cash flow, tenant quality, lease terms, replacement costs, and long term market fundamentals instead of relying primarily on future appreciation.
Current market cap rates have remained relatively stable compared to our previous report. That suggests pricing expectations between buyers and sellers are becoming more aligned, allowing more transactions to move forward. While each property type faces its own opportunities and challenges, Central Texas continues to benefit from population growth, job creation, and significant corporate investment, making it one of the strongest long term commercial real estate markets in the country.
Capital Markets Snapshot

One of the most encouraging signs in this month’s report is the stability in market cap rates across the major commercial property sectors.
Current Market Snapshot by Property Type

While cap rates remain above the levels seen several years ago, they have shown signs of leveling off. This indicates buyers and sellers are gradually finding common ground on pricing.
It is also important to note that the CoStar report presents 2026 as year to date data, while prior years represent full calendar years. Because of this, comparing total sales volume from 2026 directly to previous years would not provide an accurate picture. Instead, this report focuses on current market conditions, pricing trends, and investor behavior.
Investors Are Buying Again
The biggest takeaway from this month’s report is not simply that buyers have returned. It is that they are approaching acquisitions differently.
Today’s investors are taking more time to evaluate each opportunity before making a purchase. They are asking key questions:
- How secure is the property’s income?
- How strong are the tenants?
- Are lease rates sustainable?
- What deferred maintenance exists?
- How will insurance and property taxes affect future returns?
- Does the investment still make sense if interest rates remain elevated?
This more disciplined approach is creating a healthier market. Quality assets continue attracting buyers while properties with weaker fundamentals require more realistic pricing.
Sector Analysis
Office Market
Office properties continue to carry the highest perceived investment risk, which is reflected in the higher market cap rates.
At the same time, our team has seen increased leasing activity across Central Texas compared to earlier this year. More businesses are actively evaluating office space, particularly companies looking for quality environments while remaining mindful of occupancy costs.
Investors are still selective when purchasing office properties, but well located buildings with strong tenancy, modern amenities, and competitive pricing are generating renewed interest. Rather than a broad recovery across the entire office sector, the market is rewarding properties with solid fundamentals.
Multifamily
Multifamily continues to attract significant investor interest. Its lower cap rate reflects continued confidence in Central Texas housing demand, supported by population growth, employment gains, ongoing migration, and the need for rental housing.
Although increased apartment construction has created additional competition in some areas, long term fundamentals remain favorable. Investors continue to view multifamily as one of the region’s most stable commercial asset classes.
Retail
Retail continues to perform better than many expected. Neighborhood shopping centers, restaurants, healthcare providers, fitness facilities, and service oriented businesses continue benefiting from Central Texas’ growing population.
Many communities still need additional retail development to serve new residents. This continues creating opportunities for investors, developers, and business owners looking to expand into high growth areas. Today’s strongest retail demand is centered around businesses that provide everyday services to rapidly growing suburban communities.
Industrial
Industrial remains one of the strongest long term stories across Central Texas. Although investment activity has slowed from the record pace experienced several years ago, the long term demand drivers remain in place.
Major employers including Samsung, Tesla, Apple, and other advanced manufacturing companies continue supporting industrial growth throughout the region. Communities including Taylor, Hutto, Georgetown, Round Rock, and surrounding areas continue attracting logistics, manufacturing, distribution, and service businesses seeking locations with convenient access to major transportation corridors. Industrial buyers remain disciplined, but confidence in the long term outlook remains strong.
What We’re Seeing Locally
While national headlines often focus on uncertainty, our conversations with owners, developers, investors, tenants, and business leaders continue telling a positive story:
- Developers remain actively searching for future projects.
- Business owners continue evaluating expansion opportunities.
- Investors are reviewing acquisition opportunities throughout the region.
- Office users are touring more available space than they were just a few months ago.
Overall activity is not being driven by speculation. It is being driven by thoughtful decision making and long term planning. That reflects a healthier commercial real estate market where disciplined investments have replaced the urgency that characterized previous market cycles.
“Today’s commercial market feels healthier than it did during the investment frenzy several years ago. Serious buyers have not disappeared. They have simply become more disciplined. Developers are still looking for opportunities, businesses continue expanding, and investors are still deploying capital into quality assets. Central Texas remains one of the country’s strongest long term growth markets, and we continue seeing confidence from people making decisions based on strong fundamentals instead of short term speculation.”
— Robert J. Fischer, CCIM, Broker Associate
Outlook
Central Texas continues to benefit from powerful economic drivers that extend well beyond short term interest rate cycles. Population growth, corporate expansion, infrastructure investment, and business relocation continue supporting long term demand for commercial real estate throughout the region.
While today’s investment environment requires more careful analysis than previous years, it is also creating a healthier marketplace built on realistic pricing, sound underwriting, and sustainable growth.
For investors, owners, developers, and business leaders, the message remains consistent: Commercial real estate opportunities continue to exist throughout Central Texas. Success today belongs to those who remain patient, make informed decisions, and focus on long term value rather than short term market cycles.
Download June 2026 Commercial Data Report
Data Sources and Methodology: This report includes market analysis and commentary prepared by the Robert J. Fischer Team using third-party market data sources, including
CoStar market research data. Information is interpreted and summarized for informational and educational purposes only and should not be considered investment, legal, tax, or financial advice. Market statistics are believed reliable but are not guaranteed. Readers should independently verify all information. 2026 data is year-to-date and should not be treated as a completed-year comparison.
Central Texas Commercial Capital Markets Report: Austin-Market Data Shows Selective Re-Engagement, Not a Full Rebound Yet
Commercial real estate capital is beginning to move again across the Austin market, but investors, users, owners, and developers remain disciplined after a major reset in pricing, interest rates, and transaction volume.
The Austin-area commercial real estate market is no longer in the same environment it was during the ultra-aggressive capital markets cycle of 2021 and early 2022. That market is gone. But the current market is also not frozen.
The latest Austin-market commercial capital markets data points to a more selective, disciplined, and cautious environment where capital is still moving, but only when pricing, income, location, tenant quality, financing, and future growth assumptions make sense.
This report uses selected CoStar capital markets data for the Austin - TX USA market, combined with local commercial real estate observations from the Robert J. Fischer Team. Because the CoStar geography is labeled "Austin - TX USA," the underlying data should be understood as Austin-market data rather than city-of-Austin-only data or a complete Central Texas dataset. Our commentary applies that Austin-market data through the lens of broader Central Texas commercial activity, including growth corridors such as Round Rock, Georgetown, Hutto, Taylor, Cedar Park, Pflugerville, Leander, and the surrounding region.
Commercial real estate activity is re-engaging, but the recovery is uneven by asset class. Office remains the most challenged and most selective. Multifamily continues to attract long-term investor attention. Retail remains comparatively resilient. Industrial is still supported by long-term regional growth, but capital markets volume has slowed from prior peaks.
At the same time, many local operators believe Central Texas has already absorbed much of its correction and is beginning to move into an emerging opportunity phase. That does not mean every deal works today or that every asset will benefit equally. But it does mean the region’s long-term growth story remains intact.
Major employers, population growth, advanced manufacturing, technology investment, semiconductor activity, logistics demand, and continued business relocation all continue to support the long-term case for commercial real estate across Central Texas.
Executive Summary
The Austin-market commercial capital markets data shows a market still working through the effects of higher interest rates, tighter underwriting, more selective lending, and a major reset from the peak transaction years.
Across all property types, the latest 2026 year-to-date / trailing capital markets data shows approximately $1.29 billion in sales volume, down about 43% from the prior period. That confirms that transaction volume remains well below the more aggressive investment environment of previous years.
However, the latest quarter-to-date data also shows that deals are still happening. For 2026 Q2 quarter-to-date, the Austin market recorded approximately $165.4 million in sales volume across all property types in the data reviewed.
The story is not simply “commercial real estate is down.” Commercial real estate has reset, and capital is now moving selectively toward assets where the risk-adjusted return makes sense.
$1.29B Current Year-to-Date / Trailing Sales Volume
-43% Sales Volume Decline from Prior Period
$165.4M 2026 Q2 Quarter-to-Date Sales Volume
Key Takeaways
- Total Austin-market commercial sales volume remains meaningfully below prior peaks, with approximately $1.29 billion in current year-to-date / trailing sales volume, down about 43%.
- Office continues to face the most pressure, but it also represented a large share of recent quarter-to-date sales volume, showing that investors are still engaging when pricing and risk align.
- Multifamily remains the largest sector by current trailing sales volume, with approximately $547.5 million in volume and a market sale price around $218,000 per unit.
- Retail continues to show relative resilience, with approximately $190.6 million in trailing sales volume, pricing around $342 per square foot, and a market cap rate near 6.35%.
- Industrial sales volume is down meaningfully, but the long-term regional case remains tied to population growth, logistics demand, advanced manufacturing, Samsung-related activity, and the Austin-to-Taylor-to-Hutto growth corridor.
- Cap rates remain elevated compared to the low-rate era, with market cap rates around 7.91% for office, 7.54% for industrial, 6.35% for retail, and 5.71% for multifamily.
- As investors move farther from Austin’s urban core into emerging growth corridors, cap rates can often move higher, which may create opportunity for investors willing to underwrite location, lease-up, infrastructure, and long-term growth carefully.
- The market is not rewarding generic optimism. Buyers are underwriting carefully, sellers need to price realistically, and developers are moving forward selectively.
- Many local operators believe the area has already gone through much of its correction and is now entering an emerging opportunity phase where early adopters are beginning to re-engage.
Source and Geography Note
This report uses selected CoStar capital markets data for the Austin - TX USA market. The workbook does not appear to represent only the City of Austin, and it should not be interpreted as a complete all-of-Central-Texas dataset unless additional geography-specific data is pulled.
For that reason, this report refers to the data as Austin-market commercial capital markets data and then interprets it through a broader Central Texas lens.
This report is an independent market analysis prepared by the Robert J. Fischer Team using selected third-party market data and local commercial real estate observations. It is intended for general informational purposes only and should not be relied upon as legal, tax, financial, investment, or valuation advice.
Overall Market: A Reset, Not a Collapse
The Austin commercial market has gone through a significant capital markets reset.
The biggest reason is not complicated: the cost of capital changed.
When interest rates were low, investors could justify aggressive pricing, lower cap rates, and forward-looking assumptions. As interest rates rose, those assumptions changed. Buyers needed higher yields. Lenders became more selective. Sellers had to adjust expectations. Some owners chose not to sell. Some buyers waited. Some development projects slowed or paused.
That is why transaction volume fell.
Across all property types in the Austin market, current data shows approximately $1.29 billion in sales volume, down about 43% from the prior period. That is a major decline and should not be ignored.
But volume declines do not always mean market failure. In many cases, they mean buyer and seller expectations have not fully aligned.
Commercial real estate markets often go through periods where sellers still remember peak pricing, buyers underwrite current debt costs, lenders tighten requirements, tenants become more selective, replacement costs remain high, and everyone waits for clarity.
That is the kind of market we appear to be in now.
However, the market is not frozen. Quarter-to-date data still shows meaningful transaction activity, and different asset classes are behaving very differently.
Sector Overview
Office: Still Challenged, But Not Ignored
Office remains the most complicated major commercial property type in the Austin market.
Current data shows approximately $307.2 million in office sales volume, down about 63% from the prior period. The market sale price is around $302 per square foot, with a market cap rate near 7.91%.
That cap rate is the highest of the major sectors reviewed, which reflects the additional uncertainty investors are underwriting in the office market.
Office buyers are still evaluating vacancy risk, tenant rollover, return-to-office trends, concessions, operating costs, debt costs, building quality, location, and whether the asset can compete for tenants in a changed market.
This does not mean all office is weak. It means office has become much more selective.
Well-located, well-leased, high-quality office assets with strong tenants can still attract attention. But older, less differentiated, highly vacant, or capital-intensive office properties may face a longer road to recovery.
The most interesting part of the recent data is that office represented a meaningful share of current quarter-to-date activity, with approximately $152.4 million in quarter-to-date office sales volume. That suggests investors are still willing to step into office when the basis, location, income, or future upside makes sense.
In other words, office is not dead. But office buyers are demanding a clearer reason to buy.
Multifamily: Long-Term Demand Remains, But Underwriting Is More Disciplined
Multifamily continues to be one of the most important asset classes in the Austin market.
The current data shows approximately $547.5 million in multifamily sales volume, making it the largest sector by current trailing sales volume among the major property types reviewed. Market sale price is around $218,000 per unit, with a market cap rate near 5.71%.
That lower cap rate relative to other sectors reflects the long-term investor confidence that still exists in multifamily. Central Texas continues to have strong long-term demand drivers, including population growth, job growth, household formation, in-migration, and affordability challenges in the ownership market.
However, multifamily is also not immune to the reset. Investors are watching interest rates, insurance costs, property taxes, rent growth, concessions, new supply, operating expenses, lending standards, and exit cap assumptions.
The difference between today and the peak market is that buyers are not underwriting every deal as if rent growth will solve every problem. They are looking much more closely at current income, realistic expense growth, and the cost of debt.
That is healthy in the long run. The multifamily market still has strong fundamentals in Central Texas, but the days of easy underwriting are gone. Buyers want to know the deal works today, not only in a best-case future scenario.
Retail: One of the More Resilient Sectors
Retail continues to look comparatively resilient in the Austin-market data.
Current data shows approximately $190.6 million in retail sales volume, down about 8.5% from the prior period. That decline is much smaller than the decline seen in several other sectors.
The retail market sale price is around $342 per square foot, with a market cap rate near 6.35%.
That pricing is notable. Among the major square-foot-based sectors reviewed, retail showed the highest market sale price per square foot.
Retail has benefited from limited new quality retail supply in many submarkets, strong population growth, suburban rooftop growth, demand for service-based retail, restaurant demand, medical and wellness uses, fitness and experiential concepts, and the continued need for neighborhood-serving commercial space.
This is especially true in fast-growing suburban areas where residential growth has outpaced retail, restaurant, entertainment, and service development.
Retail today is not just about traditional shopping. The strongest retail corridors are often driven by daily needs, food, beverage, medical, fitness, services, and experience-based uses.
Industrial: Long-Term Growth Story, Short-Term Capital Markets Discipline
Industrial remains a major long-term story in Central Texas, even though current sales volume is down.
The Austin-market data shows approximately $241.9 million in industrial sales volume, down about 58% from the prior period. Market sale price is around $175 per square foot, with a market cap rate near 7.54%.
That drop in sales volume reflects the same broader capital markets pressure affecting other sectors: higher interest rates, more selective debt, valuation uncertainty, and buyers being more cautious.
But industrial remains supported by long-term regional trends. Central Texas continues to benefit from population growth, business expansion, logistics needs, contractor and service-business demand, flex space demand, advanced manufacturing, semiconductor-related activity, and the broader Austin-to-Taylor-to-Hutto growth corridor.
Industrial demand is not uniform. Large institutional logistics, small-bay industrial, flex, contractor yards, owner-user buildings, manufacturing space, and distribution space all behave differently.
In today’s market, the strongest industrial opportunities often depend on location, access, clear height, loading, yard space, tenant demand, utility availability, and whether the asset serves real users rather than just theoretical demand.
The long-term industrial case remains strong, but buyers are more careful about what they buy and what basis they are willing to accept.
Cap Rates: Higher-Cost Capital Is Still Shaping the Market
One of the clearest themes in the data is the difference in cap rates across property types.
Current market cap rates in the Austin-market data are approximately 7.91% for office, 7.54% for industrial, 6.35% for retail, and 5.71% for multifamily.
.png)
These cap rates help explain how investors are viewing risk. Office carries the highest cap rate, which reflects uncertainty around tenant demand, leasing, vacancy, and future office usage. Industrial also carries an elevated cap rate, but the long-term demand story remains compelling in many submarkets. Retail is lower, reflecting stronger current income confidence and resilience in well-located retail assets. Multifamily remains the lowest of the major sectors reviewed, reflecting long-term confidence in housing demand, even as buyers remain disciplined on operating expenses and financing.
Ryan Owens, CCIM with the Robert J. Fischer Team, notes that as investors move farther out from Austin’s urban core into the suburbs, cap rates can often move higher.
That matters because, generally speaking, a higher cap rate means a lower price relative to the income a property produces. However, higher cap rates can also reflect different risk, location, liquidity, lease-up, infrastructure, or maturity factors. That spread can create opportunity for investors who understand the growth story and are willing to underwrite carefully.
Capital is not treating every property type or every location the same. The market is pricing risk differently by sector, location, income stability, tenant demand, and future growth prospects.
The Austin Market Is Still Repricing Around Reality
The current commercial market is not being driven by emotion the way parts of the 2021 and 2022 market were.
Today’s buyers are asking: What is the real current income? What are the actual operating expenses? What capital improvements are needed? What debt terms are available? How stable are the tenants? What happens if rents do not grow aggressively? What is the exit cap? What replacement cost supports the value? What happens if rates stay higher for longer?
That is a more disciplined market.
Sellers, meanwhile, are often asking: Do I need to sell now? Can I refinance? Should I hold until rates improve? What value can I realistically achieve? How much has buyer underwriting changed? What would make my asset stand out?
This gap between seller expectations and buyer underwriting is one of the main reasons transaction volume remains below prior years. The market is not inactive because nobody wants commercial real estate. The market is slower because buyers and sellers are still negotiating around a new reality.
What This Means for Commercial Property Owners
For owners, the current market requires realistic positioning. The strongest owners are preparing clean financials, understanding current cap rates and buyer expectations, not relying only on peak-era comparable sales, addressing deferred maintenance or pricing around it, highlighting tenant stability and income quality, understanding how debt costs affect buyer offers, and being honest about vacancy, rollover risk, and capital needs.
In this market, buyers are not just buying buildings. They are buying income, risk, location, optionality, and future upside. Owners who can clearly communicate those strengths will be better positioned than owners who simply bring a property to market and hope for peak pricing.
What This Means for Investors
For investors, this is a more interesting market than the headlines may suggest.
A slower transaction market can create opportunity, especially for buyers who are patient, well-capitalized, and able to underwrite carefully. The opportunity is not that everything is cheap. The opportunity is that some assets may now be priced more realistically than they were during the peak market.
Investors should be looking closely at basis, replacement cost, tenant quality, lease rollover, future capital needs, submarket fundamentals, debt structure, and long-term demand drivers.
This is not a market for sloppy underwriting. But it may be a good market for investors who understand Central Texas and are willing to buy before the broader recovery becomes obvious.
What This Means for Tenants and Owner-Users
For tenants and owner-users, the current market can offer more negotiating room than the previous cycle, depending on the property type and location.
Office tenants may have more leverage in certain submarkets, especially where vacancy is elevated or landlords are trying to secure long-term occupancy. Industrial tenants and owner-users may still face competition for well-located, functional space, especially in smaller-bay, flex, contractor-oriented, and growth-corridor properties. Retail tenants may find opportunities in emerging corridors, but the best retail sites remain competitive because of limited supply and strong population growth.
Owner-users should also pay close attention to financing. Monthly payment matters, and the right structure can make a major difference.
What This Means for Developers
For developers, the current market is selective but not closed.
Development activity is much more disciplined than it was during the most aggressive part of the previous cycle. Higher rates, construction costs, insurance, infrastructure, entitlement timelines, and lender requirements all matter more now.
But Central Texas still has real growth drivers. The Austin-to-Taylor-to-Hutto corridor remains one of the most important areas to watch because of the concentration of major employer activity, advanced manufacturing, semiconductor-related growth, infrastructure investment, and relative land availability.
One reason developers continue watching this corridor is the concentration of major employer activity. Tesla, Samsung, SpaceX-related activity, Amazon, Apple, and other advanced manufacturing and technology investments continue to support the long-term case for housing, industrial, retail, hospitality, and mixed-use development across the region.
Developers are not moving recklessly, but they are studying opportunities again. That is often how the next cycle begins.
Emerging Market Opportunity: Why Early Capital Is Starting to Re-Engage
One of the more important local themes we are seeing is that many owners, investors, developers, and business leaders believe Central Texas has already gone through much of its correction.
The market is not back to the ultra-aggressive environment of 2021 and early 2022, and that is probably healthy. Pricing had moved too quickly, interest rates changed the math, and many buyers and developers had to pause while the market reset.
But after that correction, the conversation is beginning to shift.
More groups are starting to view the Austin-area and broader Central Texas market as an emerging opportunity again. The reason is simple: the long-term growth drivers are still here.
Major employers, advanced manufacturing, technology investment, semiconductor activity, electric vehicle production, logistics demand, population growth, and continued business relocation all continue to support the long-term case for commercial real estate in the region.
Locally, we are beginning to see more absorption, more business interest, and more groups looking at different properties again. That does not mean every project works or every asset is ready to move. Financing still matters. Interest rates still matter. Construction costs still matter. Insurance, infrastructure, utilities, and entitlement timelines still matter.
But this is often what the early stage of a recovery looks like. The market corrects. Activity slows. Buyers and developers pause. Then the stronger long-term operators begin studying opportunities again before the broader market fully recognizes the shift.
If borrowing costs and development financing improve, that could become one of the most important accelerators for the next phase of commercial activity in Central Texas.
The opportunity today is not based on hype. It is based on the combination of corrected pricing, long-term job growth, business expansion, and the possibility that the next cycle is beginning to form before it is obvious in the traditional data.
The Connection Between Residential and Commercial Activity
Residential and commercial real estate do not move in isolation.
When residential activity improves, it often supports retail, service businesses, medical users, restaurants, schools, childcare, storage, and other neighborhood-serving commercial uses. When commercial activity improves, it supports job growth, household formation, relocation, housing demand, and future development.
In our recent residential microdata reporting, early June buyer activity showed signs of re-engagement. ShowingTime-recorded showings were up year-over-year across the Williamson County and Travis County ZIP codes reviewed, while new listing flow was not materially higher. Pending activity also improved.
That matters to the commercial side because consumer confidence, mobility, employment, housing activity, and local business growth are all connected.
The commercial data is showing a similar theme, just at a slower and more capital-sensitive pace. The market paused. It reset. Now it is beginning to re-engage selectively.
Why This Market Requires Local Interpretation
Commercial real estate data is useful, but it can be misleading without local interpretation.
A market-wide office cap rate does not tell you the difference between a stabilized medical office building, a suburban professional office building, a downtown high-rise, and an older vacant property needing major capital. A market-wide retail sales price does not tell you the difference between a grocery-anchored center, a small strip center, a restaurant pad, or a neighborhood service center. A market-wide industrial number does not tell you the difference between bulk logistics, small-bay flex, owner-user industrial, outdoor storage, and manufacturing-related space.
That is why local interpretation matters. The numbers tell us the market has reset. The local work is figuring out which assets are positioned for the next phase.
Sector Scorecard
| Sector |
Current Read |
Main Takeaway |
| Office |
Selective / challenged |
Buyers still engage when basis, income, and risk make sense. |
| Multifamily |
Long-term demand |
Demand remains supported, but underwriting is more disciplined. |
| Retail |
Comparatively resilient |
Population growth supports service-based and daily-needs retail. |
| Industrial |
Long-term growth story |
Volume is down, but fundamentals remain tied to regional growth. |
Outlook: Selective Recovery Ahead
The Austin-market commercial capital markets data points to a market that is still recovering from a major reset.
The next phase will likely depend on whether interest rates stabilize or decline, whether lenders become more active, whether sellers adjust expectations, whether tenant demand continues to hold, whether insurance and operating costs stabilize, whether developers can make new projects pencil, and whether job growth continues to support long-term demand.
The market is not back to peak conditions, and that is probably healthy. The previous cycle moved too fast. This cycle is more disciplined.
For owners, that means pricing and preparation matter. For buyers, that means opportunity exists, but only with careful underwriting. For tenants and owner-users, that means leverage varies by sector and submarket. For developers, that means the best opportunities are likely in corridors where growth, infrastructure, city support, land availability, and long-term demand align.
The market is not booming today, but the foundation for the next cycle is being rebuilt. Early adopters are not necessarily betting on today’s headlines. They are underwriting tomorrow’s growth.
Final Takeaway
The Austin commercial real estate market is not booming. It is not frozen. It is repricing, resetting, and selectively re-engaging.
That may not sound as exciting as the previous boom cycle, but it is a healthier foundation for long-term commercial real estate decisions.
Capital is still moving, but it is moving carefully.
And in Central Texas, where major employers, population growth, advanced manufacturing, and continued business expansion remain long-term drivers, careful capital may be the first sign of the next cycle taking shape.
In a market like this, strategy matters more than hype. And for Central Texas, the long-term fundamentals remain strong.
Data Sources and Methodology: This report includes market analysis and commentary prepared by the Robert J. Fischer Team using third-party market data sources, including selected CoStar market research data for the Austin - TX USA market. Information is interpreted and summarized for informational and educational purposes only and should not be considered investment, legal, tax, or financial advice. Market statistics are believed reliable but are not guaranteed. Readers should independently verify all information.
Austin Metro Capital Markets Remain Selective, But Early Q2 Activity Shows Re-Engagement
The Central Texas commercial real estate capital markets remain selective, but they are not frozen. The latest Austin market-wide capital markets data shows transaction volume is still meaningfully below prior-cycle levels, yet early Q2 activity indicates buyers, sellers, lenders, and investors are beginning to re-engage in specific sectors where pricing, income, and risk assumptions make sense today.
The key story is not a broad-based surge. It is a disciplined return of activity after a long reset. Deals are getting done, but they are getting done differently than they were in 2021 and 2022. Buyers are underwriting more carefully, sellers are being forced to meet the market, and lenders remain focused on durable income and realistic assumptions.
For local business owners, tenants, landlords, and private investors, the practical message is clear: the market is no longer priced for peak-cycle optimism, but quality assets with real demand can still move.
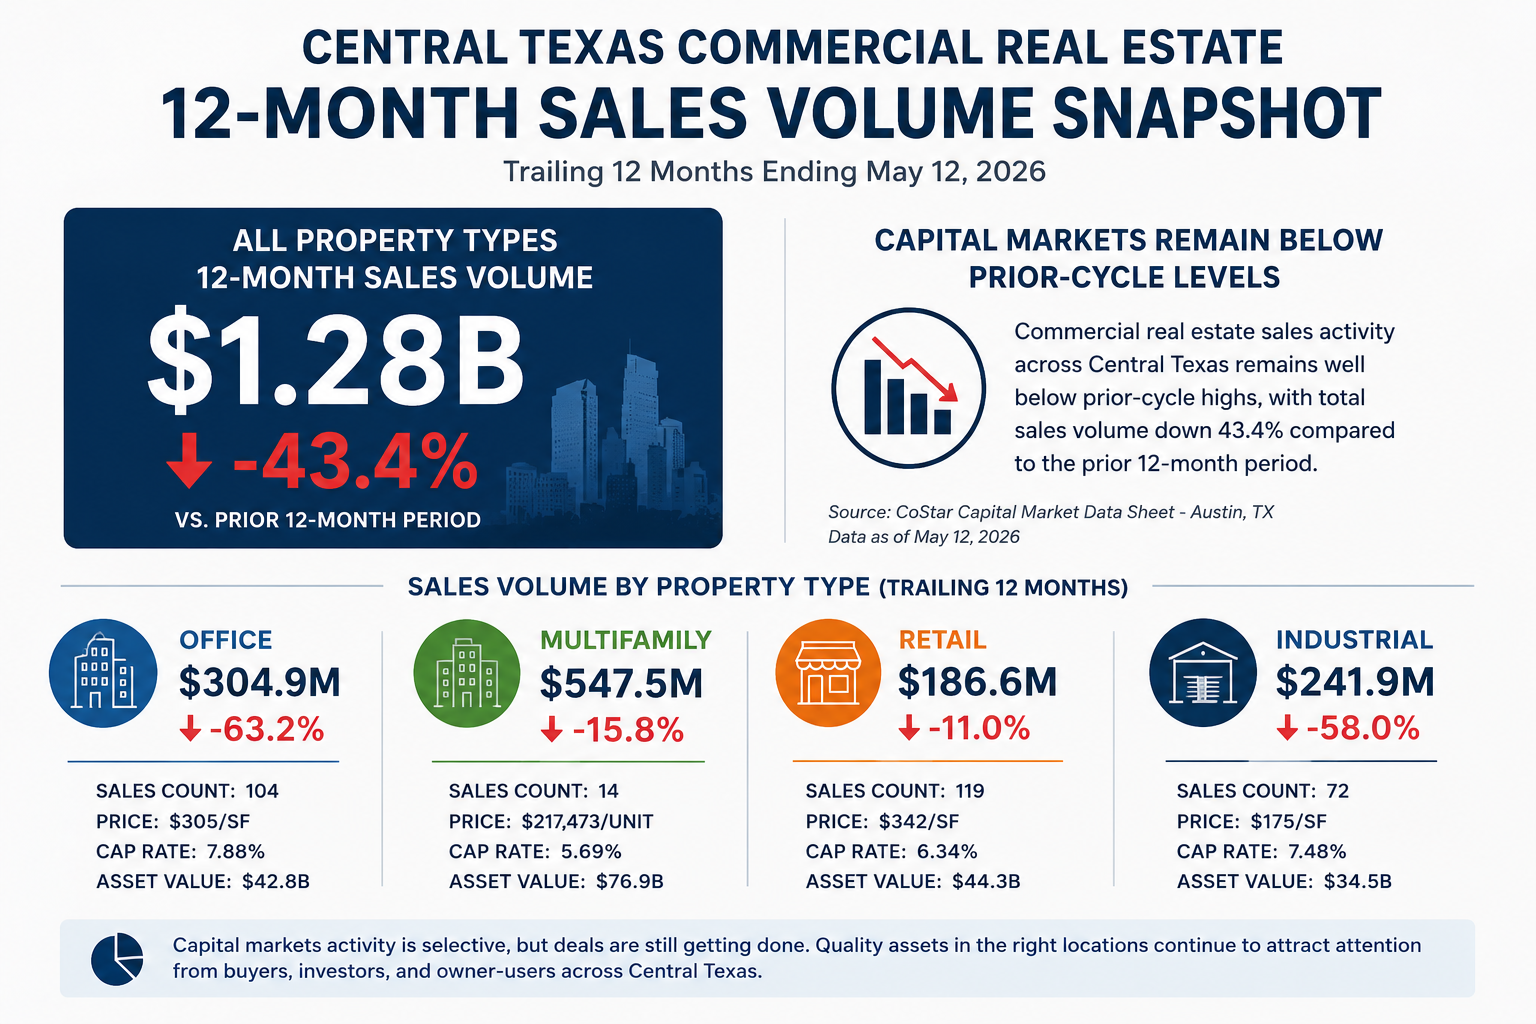
$1.3B Trailing 12-month sales volume across all property types
-43.4% Rolling 12-month sales volume growth across all property types
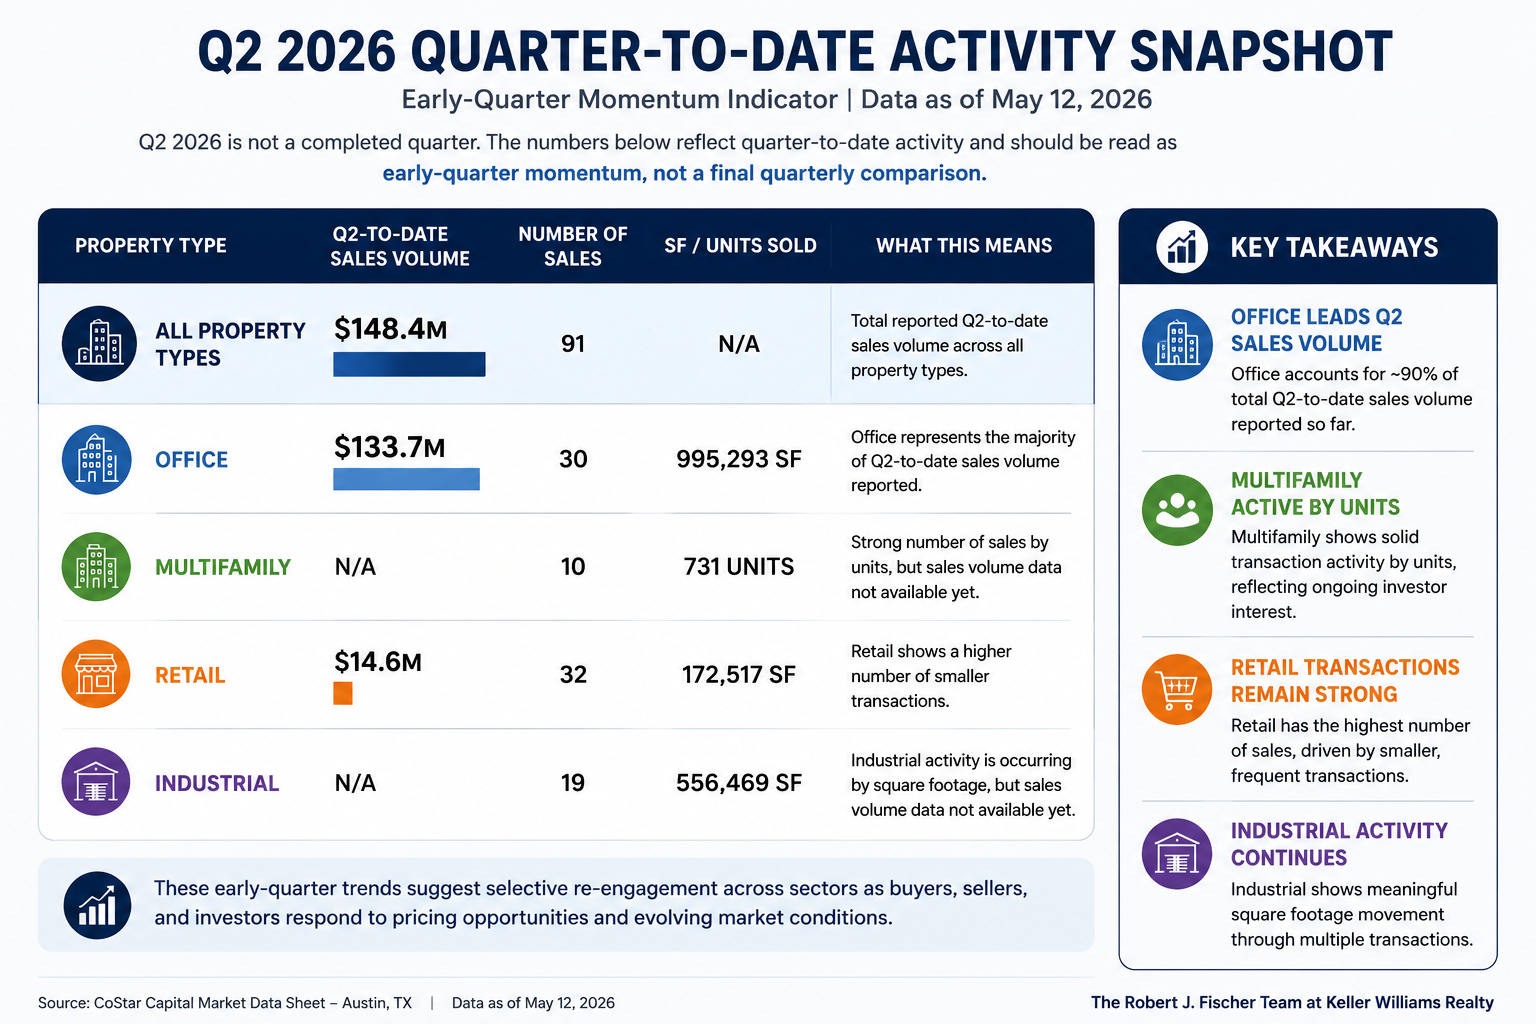
$148.4M Q2 2026 quarter-to-date reported sales volume
91 Sales Q2 2026 quarter-to-date reported transactions
Key Takeaways
- All property types show approximately $1.3 billion in trailing 12-month sales volume, down 43.4% from the prior comparable period.
- Q2 2026 quarter-to-date activity shows approximately $148.4 million in reported sales volume across 91 sales, though Q2 is still incomplete.
- Office remains challenged overall, with trailing 12-month office sales volume down 63.2%, but early Q2 data shows office transactions are still occurring.
- Retail appears comparatively resilient, with trailing 12-month retail sales volume down 11.0%, the smallest decline among the major sectors shown.
- Multifamily remains rate-sensitive, but it continues to attract attention because of long-term Central Texas population growth and housing demand.
- Industrial remains important for owner-users, contractors, logistics users, and eastern-corridor growth, even though investment sales volume is down.
Current Market Snapshot by Property Type
| Sector |
12-Month Sales Volume |
Growth |
Sales |
Price |
Cap Rate |
Asset Value |
| Office |
$304.9M |
-63.2% |
104 |
$305/SF |
7.9% |
$42.8B |
| Multifamily |
$547.5M |
-15.8% |
14 |
$217,473/unit |
5.7% |
$76.9B |
| Retail |
$186.6M |
-11.0% |
119 |
$342/SF |
6.3% |
$44.3B |
| Industrial |
$241.9M |
-58.0% |
72 |
$175/SF |
7.5% |
$34.5B |
Source: Capital Market Data Sheet - Austin - TX, May 12, 2026. Sales volume growth is a rolling 12-month growth rate. QTD data should be treated as preliminary.
Q2 2026 Quarter-to-Date Activity
| Sector |
Q2-to-Date Sales Volume |
Number of Sales |
SF / Units Sold |
| All Property Types |
$148.4M |
91 |
N/A |
| Office |
$133.7M |
30 |
995,293 SF |
| Multifamily |
N/A |
10 |
731 units |
| Retail |
$14.6M |
32 |
172,517 SF |
| Industrial |
N/A |
19 |
556,469 SF |
Q2 2026 is not a completed quarter. The numbers above should be read as early-quarter activity, not a final quarterly comparison.
Sector Analysis
Office
Office remains the most complicated sector in the current market. The data shows office trailing 12-month sales volume at $304.9 million, down 63.2%, with a market cap rate of 7.9%.
The office location data is more nuanced than the headline number. Suburban office sales volume is up 24.0%, while CBD office volume is down 99.4%. That suggests the office story is highly location- and asset-specific.
Office is not dead, but it is highly selective. Better-located, better-leased, and realistically priced assets can still trade.
Multifamily
Multifamily remains one of the most important long-term Central Texas property types because of population growth, migration, and affordability pressure. The data shows multifamily trailing 12-month sales volume at $547.5 million, down 15.8%, with a modeled market sale price near $217,473 per unit and a market cap rate of 5.7%.
The class breakdown shows 3-star multifamily sales volume up 30.5%, while 4- and 5-star multifamily is down 40.9%. This suggests middle-market assets may be trading more constructively than higher-end assets in the current capital environment.
Retail
Retail appears comparatively resilient in this dataset. Trailing 12-month retail sales volume is $186.6 million, down 11.0%. The modeled market sale price is approximately $342 per square foot, and the market cap rate is 6.3%.
Neighborhood centers and strip centers stand out within retail, with neighborhood center sales volume up 145.4% and strip center sales volume up 56.1%.
Industrial
Industrial remains a critical Central Texas growth sector even though the investment sales data shows a sharp slowdown. Trailing 12-month industrial sales volume is $241.9 million, down 58.0%, with a modeled market sale price near $175 per square foot and a market cap rate of 7.5%.
Within industrial, specialized industrial sales volume is up 261.8%, though from a smaller base. Logistics and flex volumes remain down, which points to a more selective capital environment.
What This Means for Buyers, Sellers, Tenants, and Landlords
For Buyers and Investors
The market is giving disciplined buyers more time to underwrite, but the best assets are still attracting attention. Buyers should focus on current income, realistic debt assumptions, tenant quality, replacement cost, and whether the seller has adjusted to the current rate environment.
For Sellers
Transaction activity is not gone, but sellers must price for today’s capital markets. Assets anchored to 2021-2022 expectations are more likely to stall. Well-positioned assets with clean financials, strong tenancy, and realistic pricing are more likely to move.
For Tenants and Owner-Users
This environment may create opportunity for tenants and owner-users who are decisive and well-capitalized. In many submarkets, especially suburban growth corridors, quality space remains valuable, but decision-making is more measured than it was during the peak-cycle years.
For Landlords
Landlords should expect tenants and buyers to ask more questions and underwrite more carefully. Clear property information, transparent operating data, and flexible but disciplined deal structures can help keep transactions moving.
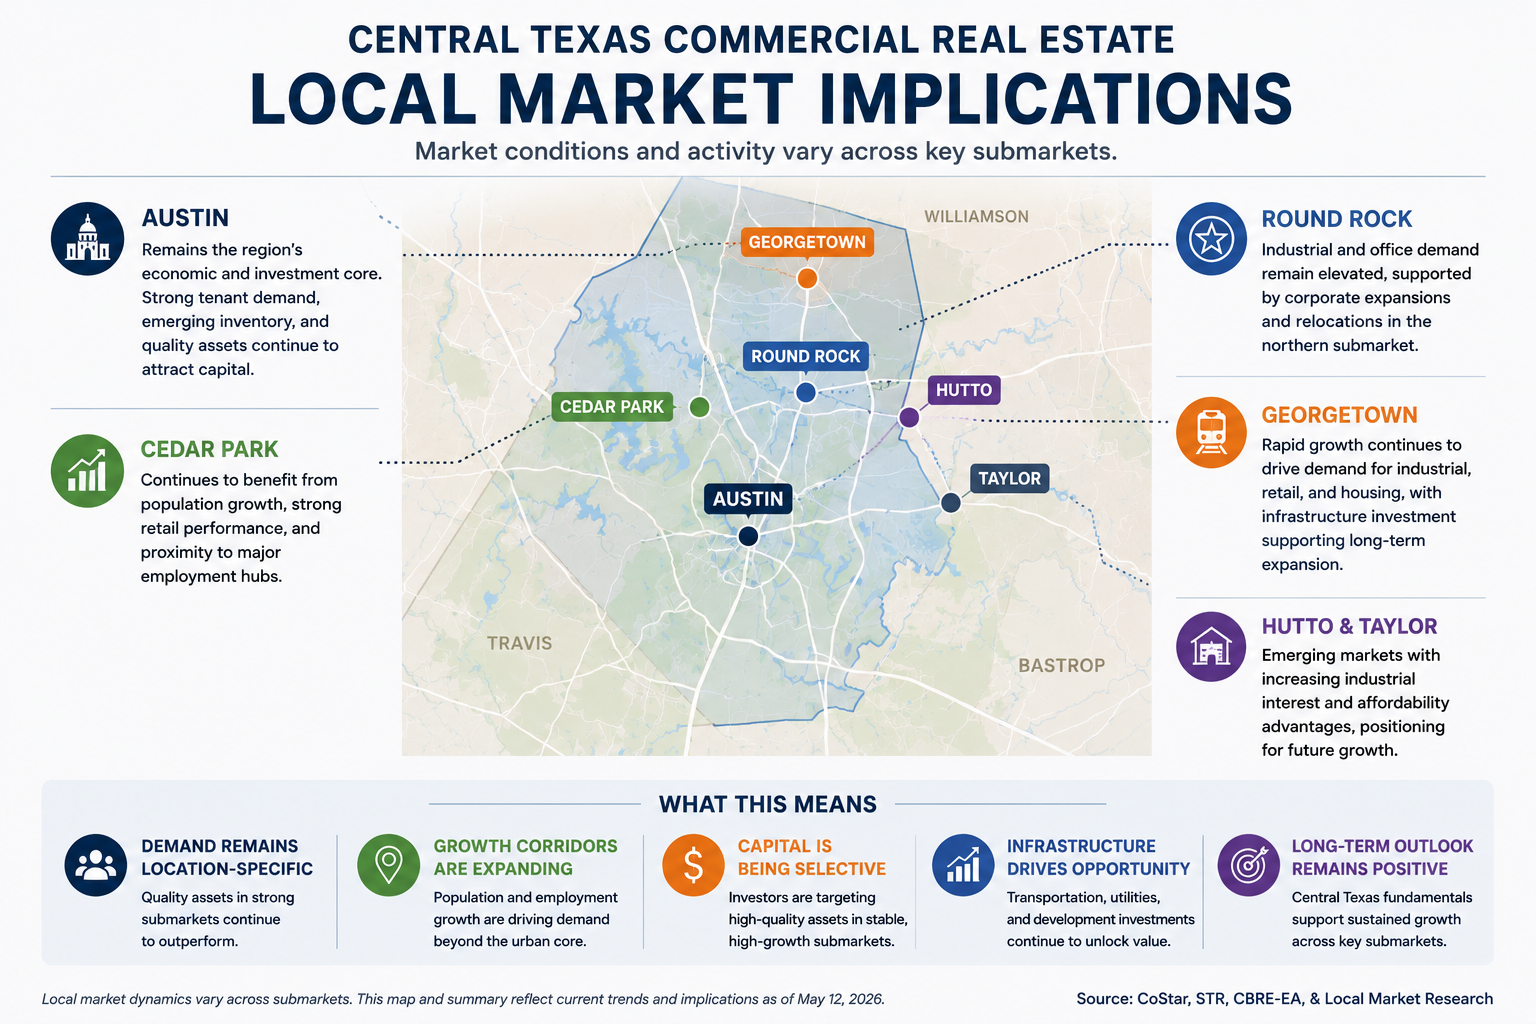
Local Central Texas Implications
Round Rock likely benefits from owner-user activity, medical and professional services, suburban retail, and business services tied to population growth.
Georgetown’s continued growth supports retail, land, medical and professional office, and service-oriented commercial demand, especially where infrastructure and rooftops are expanding.
Cedar Park remains relevant for retail and owner-user commercial demand tied to households, local business formation, and quality suburban locations.
Hutto and Taylor remain important for industrial, land, contractor yards, logistics, and supplier-related demand because of Samsung-related growth, infrastructure, and eastern-corridor expansion.
The core Austin market remains more complicated, especially for office, but high-quality assets, mixed-use locations, and well-positioned properties remain relevant to investors and operators.
Media and Press Use
The Robert J. Fischer Team publishes recurring commercial real estate market analysis focused on Central Texas investment activity, pricing trends, and local market conditions.
Reporters and media outlets may reference findings from this report with attribution to the Robert J. Fischer Team at Keller Williams Realty and a link back to this report page.
For media inquiries, interviews, or local market commentary, please contact the Robert J. Fischer Team.
Bottom Line
The Austin and Central Texas commercial real estate market is still working through a capital markets reset, but early Q2 activity and sector-level pricing data suggest the market is beginning to re-engage. The strongest opportunities are not broad, market-wide plays. They are specific assets where pricing, income, location, tenant demand, and financing assumptions line up.
The Central Texas Commercial Real Estate Capital Markets Report is designed to help local owners, investors, tenants, landlords, developers, and media professionals better understand the commercial real estate trends shaping the region.
Data Sources and Methodology: This report includes market analysis and commentary prepared by the Robert J. Fischer Team using third-party market data sources, including CoStar market research data. Information is interpreted and summarized for informational and educational purposes only and should not be considered investment, legal, tax, or financial advice. Market statistics are believed reliable but are not guaranteed. Readers should independently verify all information. Q2 2026 data is quarter-to-date and should not be treated as a completed-quarter comparison.