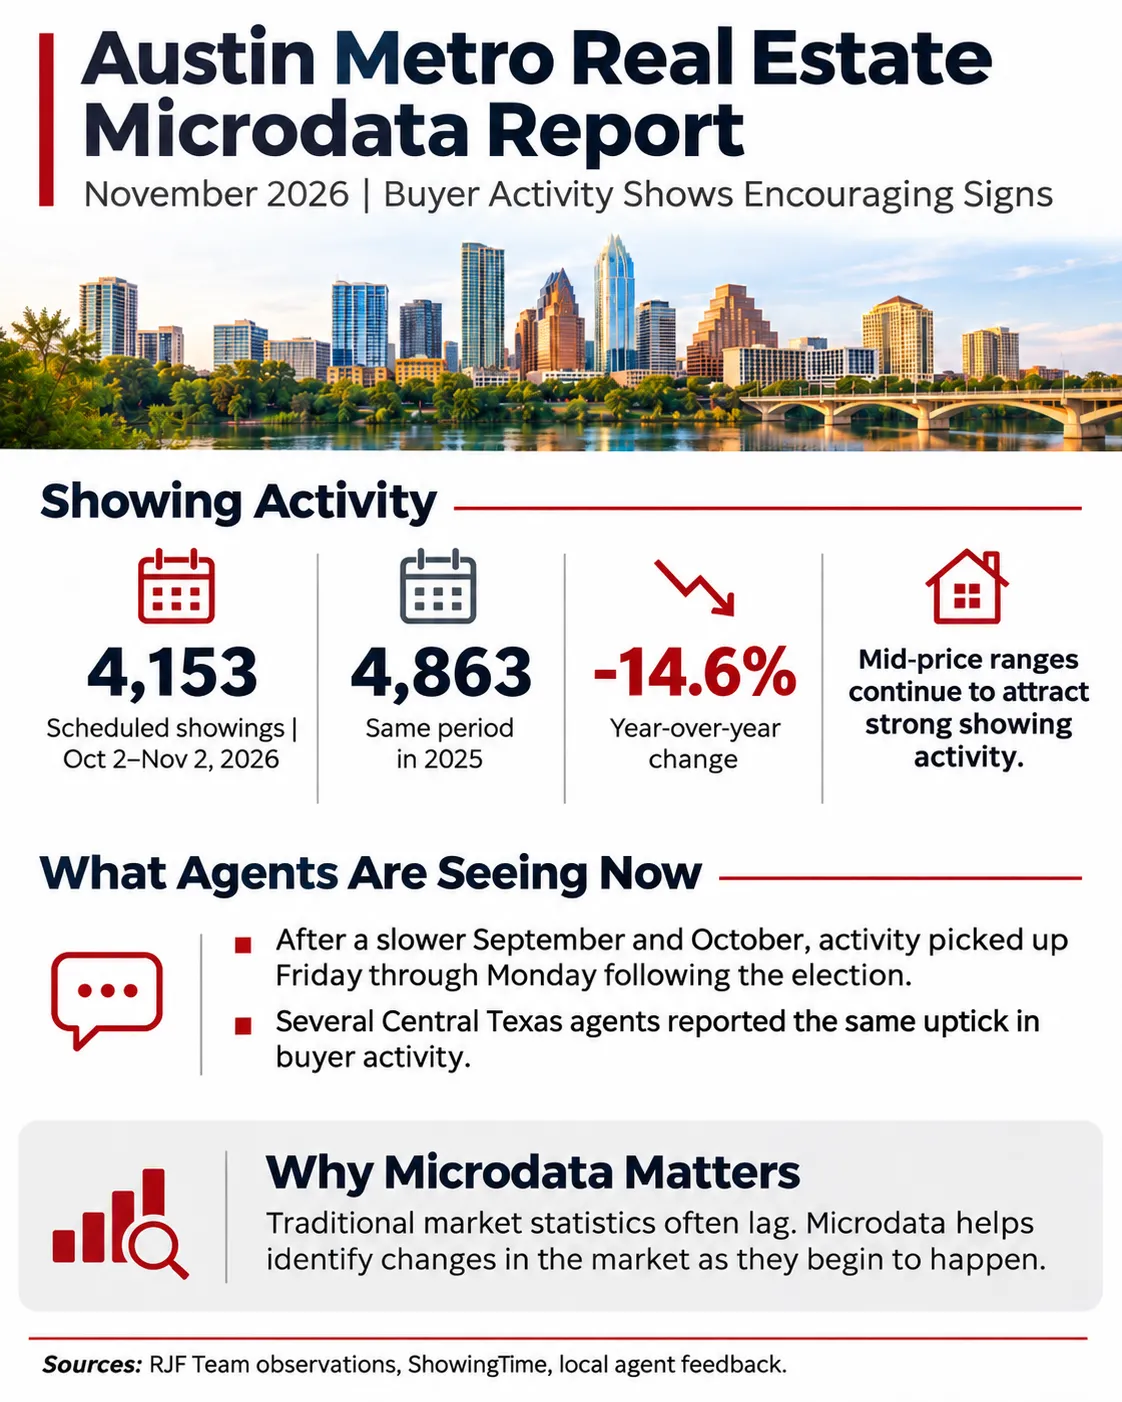
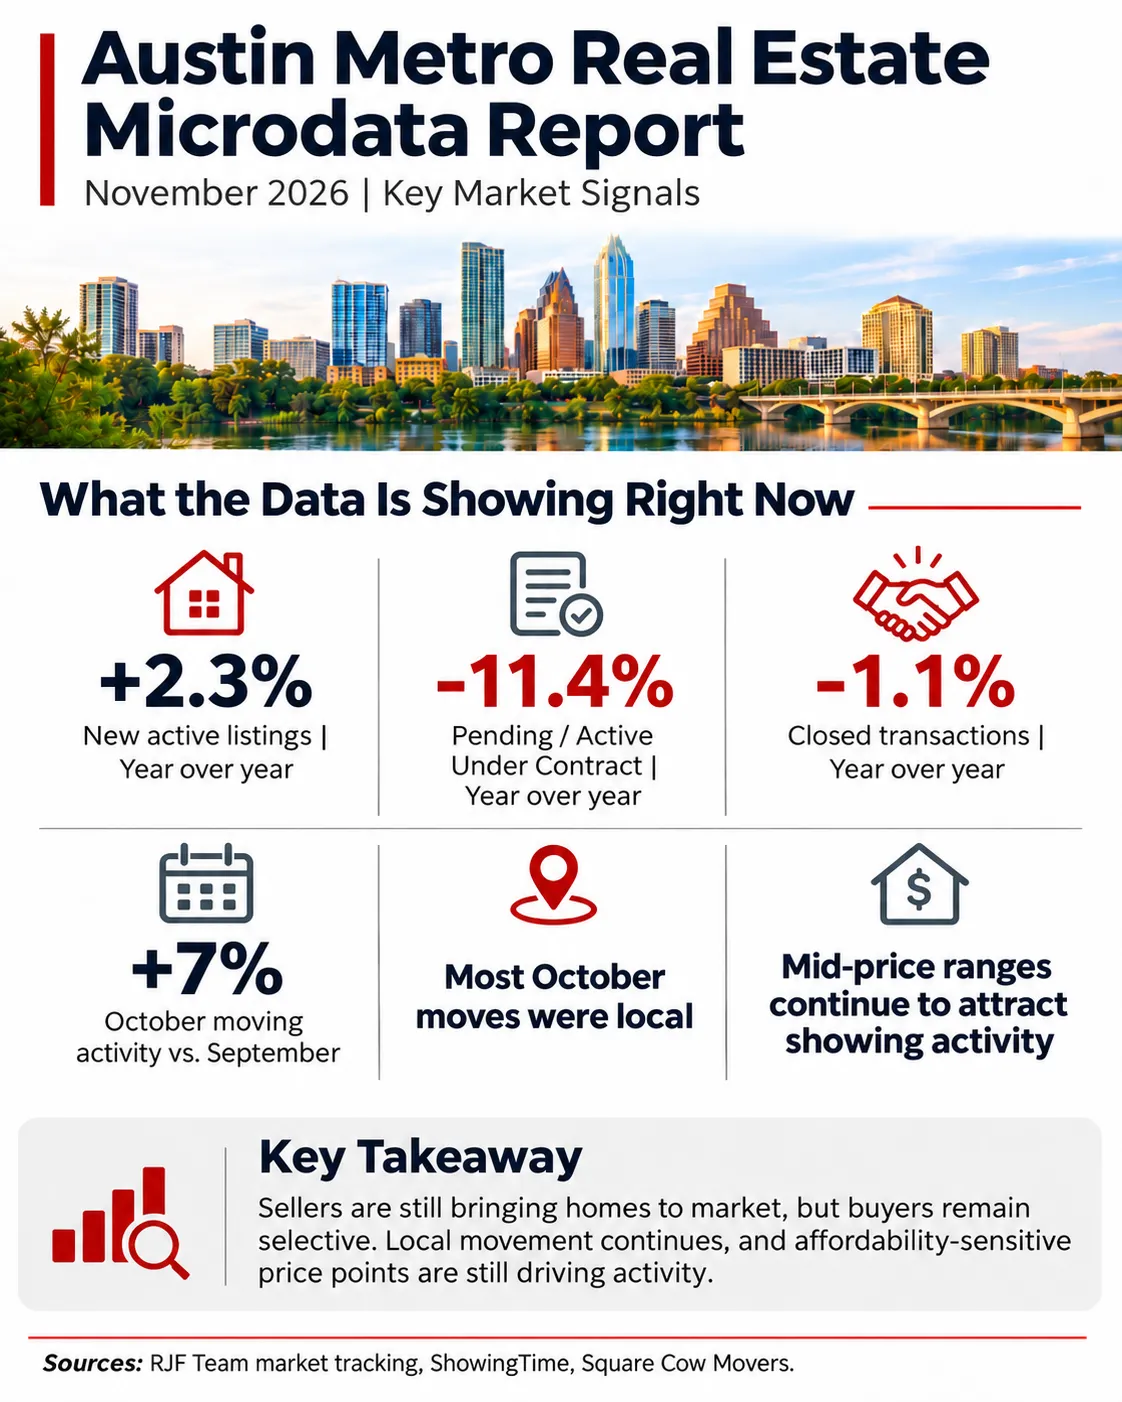
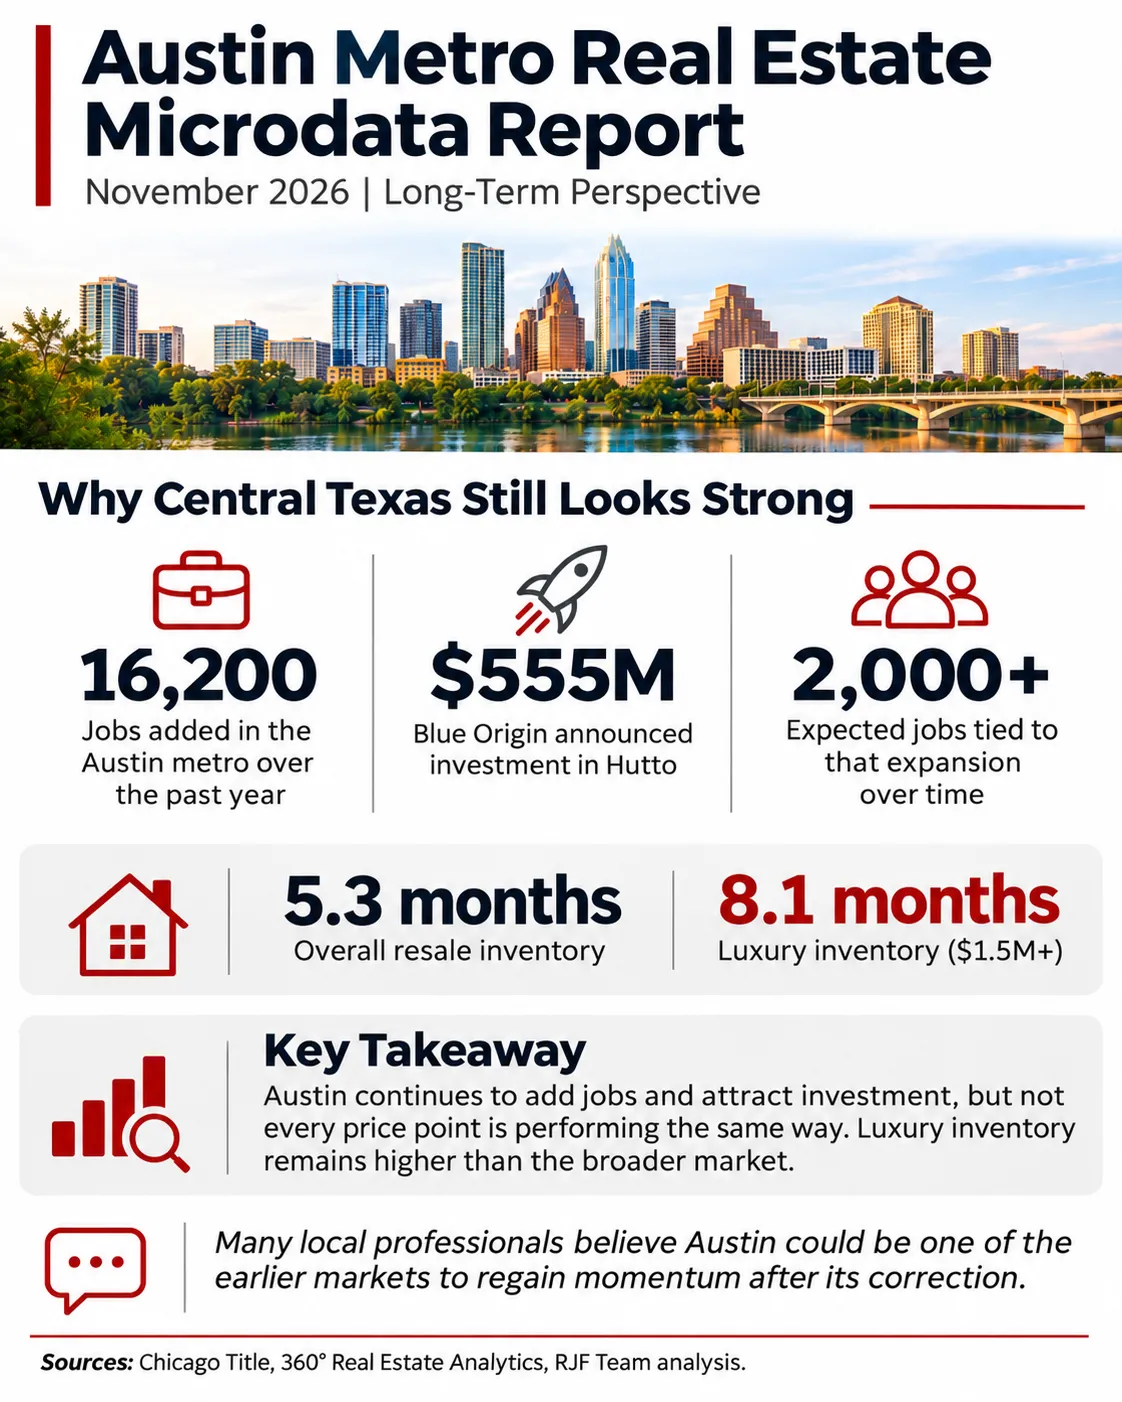
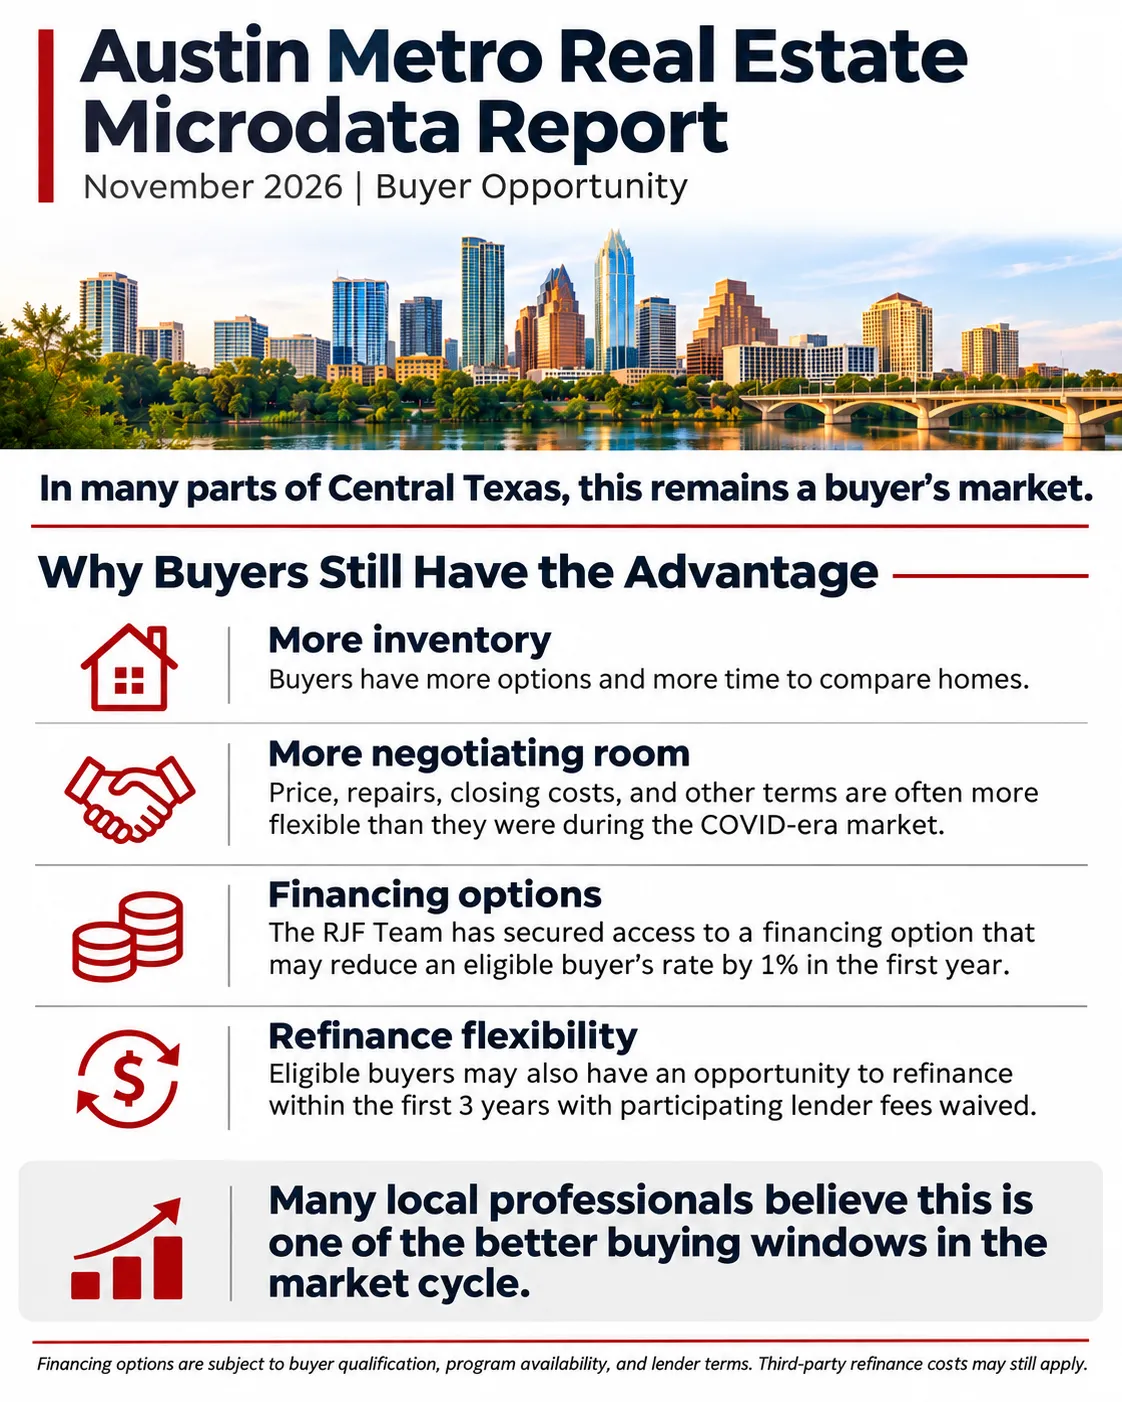
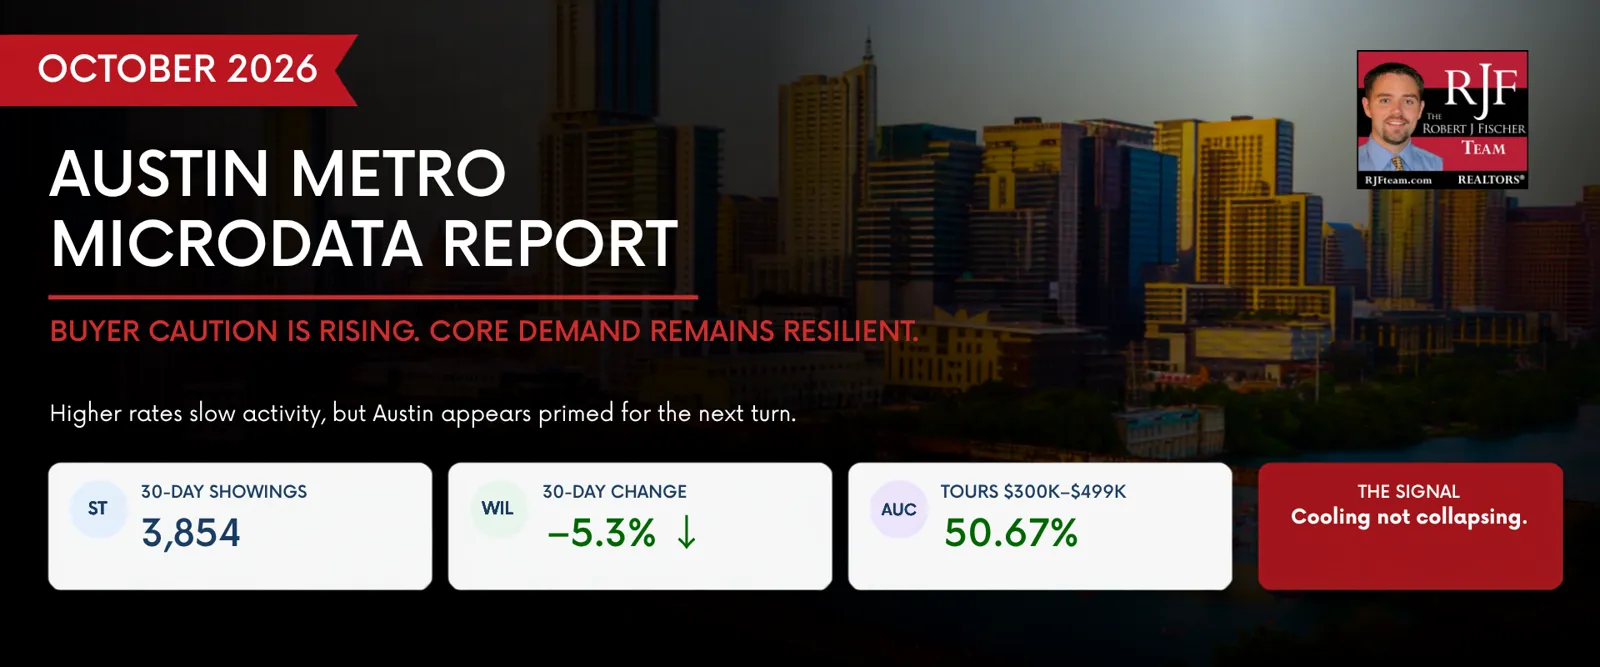
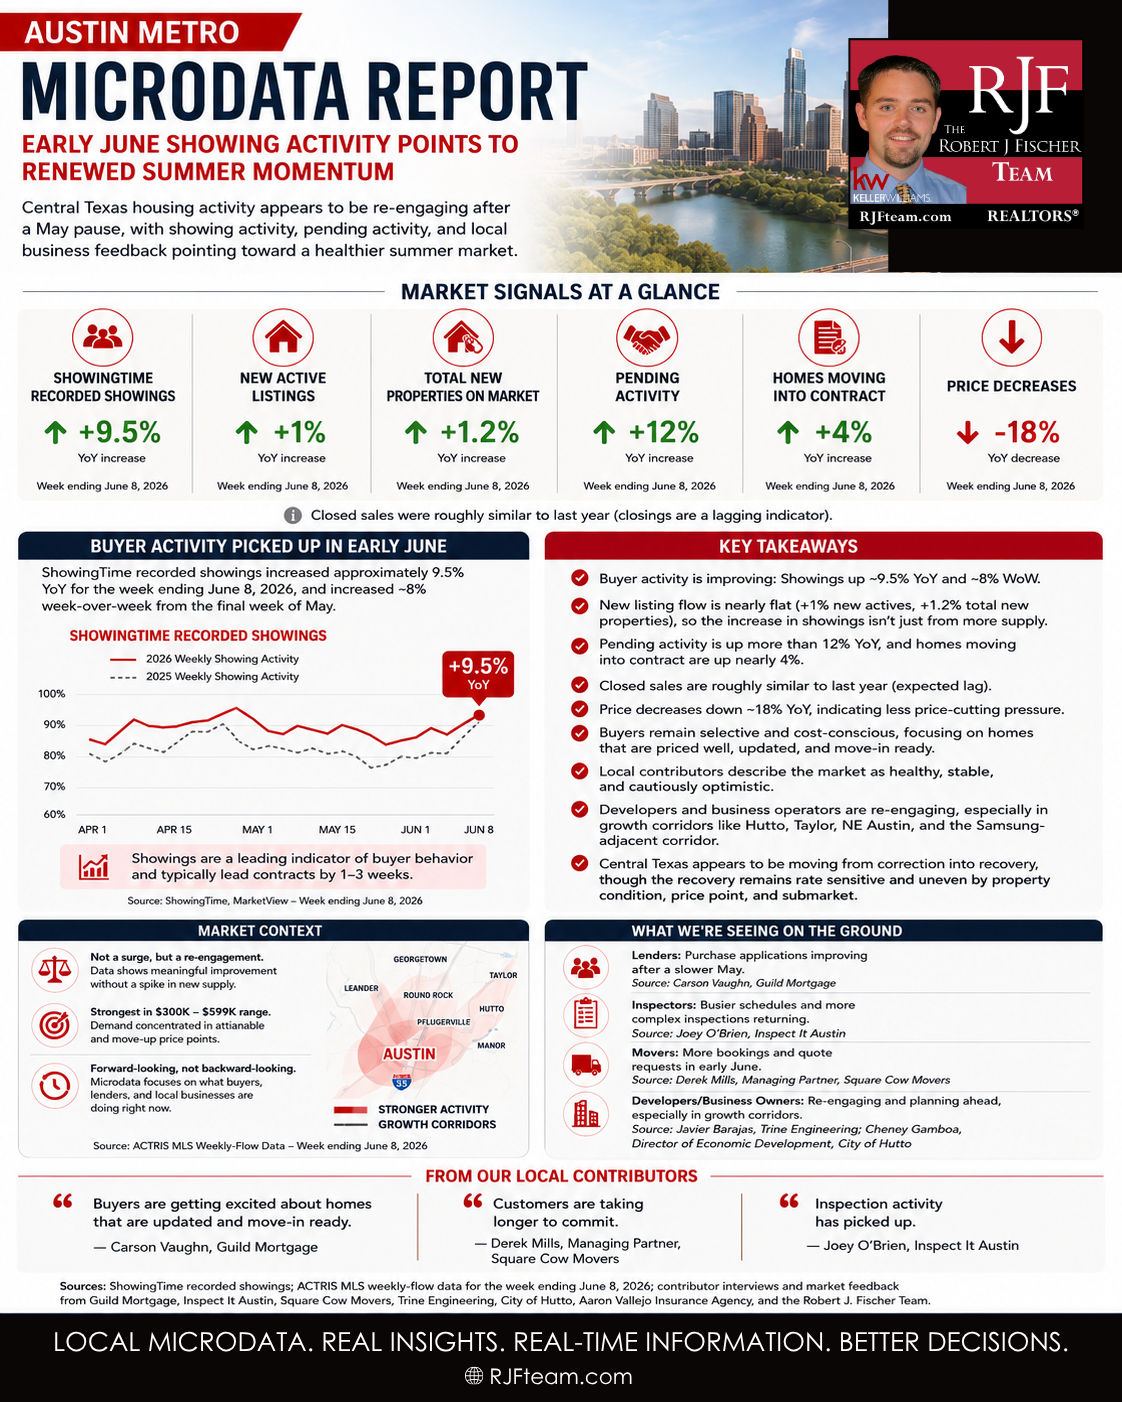
Previous Austin Metro Real Estate Microdata Reports are archived below for reference.
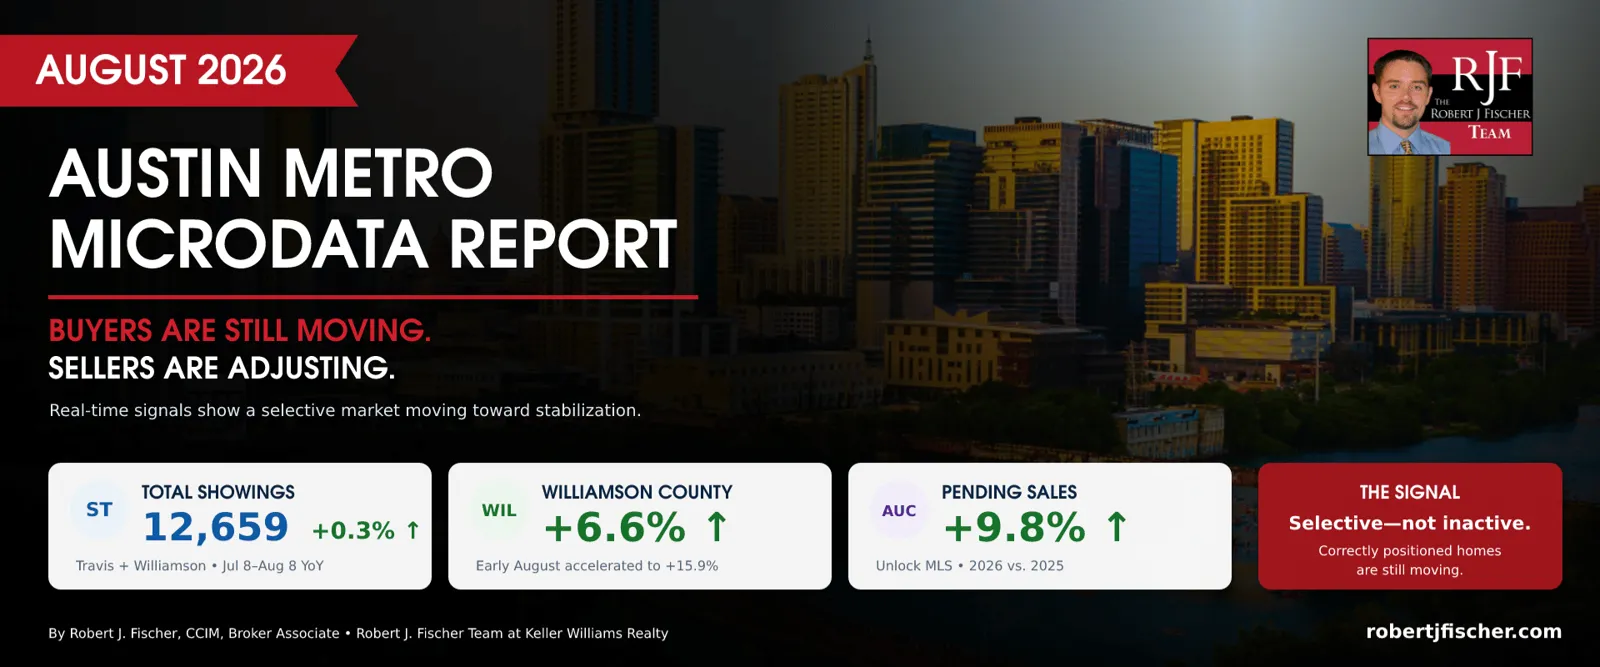
Austin Metro Real Estate Microdata Report — August 2026: Buyers Are Still Moving, Sellers Are Adjusting, and Central Texas Keeps Building
What is the state of the Austin Metro market right now? Buyers have not disappeared they are simply moving more slowly, comparing more properties, and expecting either move-in-ready condition or a price that reflects needed work. Sellers are adjusting to that behavior in real time. The Robert J. Fischer Team tracks this shift weekly through MLS status changes and ShowingTime touring data, both of which move ahead of the monthly reports most consumers see.
Key Numbers at a Glance
| Metric |
Figure |
| ShowingTime showings, Jul 8–Aug 8, 2026 (Travis + Williamson) |
12,659 (vs. 12,624 in 2025, +0.3%) |
| Travis County showings, year over year |
-4.7% |
| Williamson County showings, year over year |
+6.6% |
| Williamson County showings, Aug 1–8, 2026 vs. 2025 |
+15.9% |
| Weekly MLS price reductions |
2,000 per week |
| Weekly MLS listings moving to Active Under Contract/Pending |
1,000 per week |
| 2026 closed sales, Austin-Round Rock-San Marcos MSA (Unlock MLS) |
+4.8% year over year |
| 2026 pending sales (Unlock MLS) |
+9.8% year over year |
| 2026 median sales price (Unlock MLS) |
$425,000 (-2.4% year over year) |
| National 30-year fixed mortgage rate, 1 point (Aug 10, 2026 lender update) |
6.75% |
| Federal funds target range (July 2026 Fed meeting) |
3.50%–3.75% (9-3 vote) |
Key Takeaways
- ShowingTime tracked 12,659 showings across selected Travis and Williamson County ZIP codes from July 8–August 8, 2026, versus 12,624 during the same period last year essentially flat, up about 0.3%.
- Williamson County showings rose approximately 6.6% year over year over that month; Travis County fell approximately 4.7%.
- Williamson County showings from August 1–8 were up approximately 15.9% versus the same dates in 2025.
- Combined Travis/Williamson showing activity increased across several price bands between $400,000 and $900,000.
- Weekly MLS tracking continues to show roughly 2,000 price reductions and about 1,000 new Active Under Contract/Pending listings per week.
- Updated, move-in-ready homes and compellingly priced properties are attracting the strongest buyer attention.
- Buyers are taking more time to decide, even after finding a property they like.
- Unlock MLS data shows 2026 closed sales up 4.8% and pending sales up 9.8%, while the median price fell 2.4% to $425,000.
- Mortgage rates remain in the mid-to-upper 6% range, but buyers continue transacting around life events.
- Investors and developers are re-engaging across Central Texas.
- Samsung, regional infrastructure, and large-scale development continue reinforcing the long-term economic case for the region.
Showing activity holding up better than the headlines suggest
Yes, combined Travis and Williamson County showing activity is essentially flat year over year, which is a stronger signal than current headline pricing data implies. ShowingTime data captures buyer touring behavior before it shows up in contracts, closings, or monthly reports.
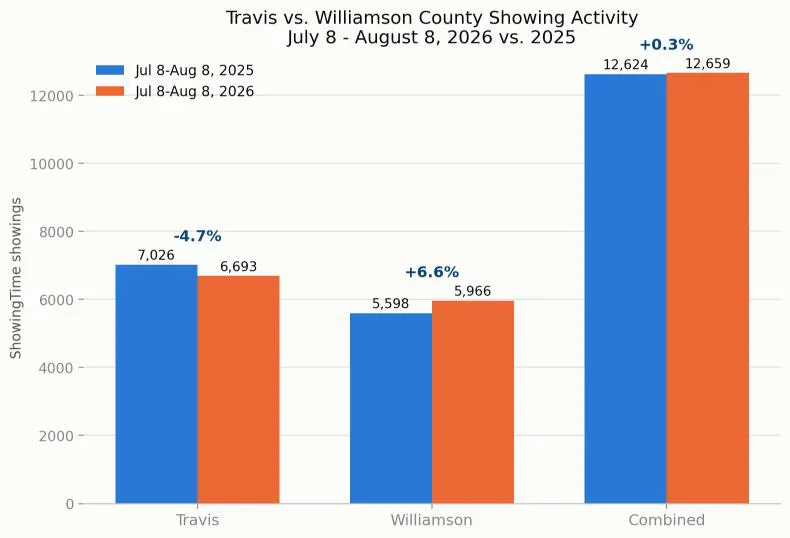
This held steady despite elevated mortgage rates, more inventory for buyers to sort through, summer travel, and the return of the school year.
Williamson County showing particular strength
Yes,early-August data shows Williamson County touring activity accelerating faster than the monthly trend. From August 1–8, 2026, ShowingTime recorded 1,552 showings in selected Williamson County ZIP codes, versus 1,339 during the same dates in 2025 an increase of approximately 15.9%.
The Robert J. Fischer Team is cautious about over-reading eight days of data, but notes it fits a broader pattern this summer: activity strengthened, softened for a couple of weeks, and has recently picked back up.
Buyer activity broader than one price range
Yes, combined Travis and Williamson showing activity increased across multiple price bands, not just entry-level homes.
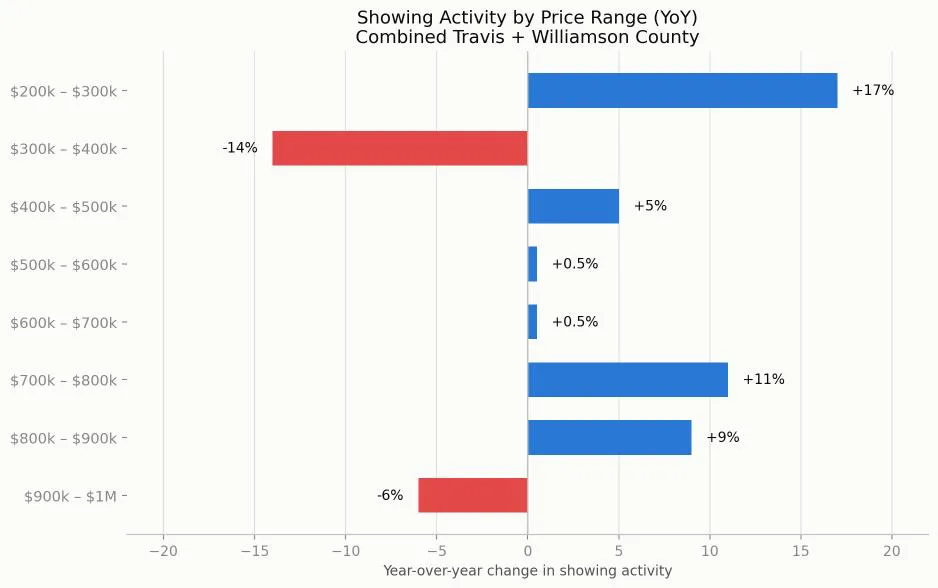
The team's takeaway: activity in one price segment tends to unlock activity in others, since entry-level buyers free up sellers who then become move-up buyers themselves.
The limits of Showing Time data
ShowingTime is directional, not comprehensive it does not capture every showing, especially in the luxury segment. Properties above roughly $1 million are frequently shown through listing agents, private appointments, or custom scheduling outside the ShowingTime system. For this reason, this report's ShowingTime analysis is limited to properties between $100,000 and $1 million and should be read as a directional indicator of buyer touring activity, not a full count of every showing in Travis and Williamson Counties.
What is the weekly MLS data telling us?
The weekly data shows a market that is actively sorting, not frozen. Roughly 2,000 listings receive a price reduction each week, while roughly 1,000 move into Active Under Contract or Pending status. Both are happening simultaneously.
- Homes buyers see as strong opportunities are moving to contract.
- Homes that aren't competing effectively are being forced to adjust.
- Traditional monthly reports describe activity that already happened; weekly MLS tracking gets closer to real time.
Why are so many sellers still cutting prices?
Because buyers are pricing homes against current competition, not past peak-market sales. A home's prior value, a seller's renovation spend, or a neighbor's 2021-era sale price don't determine what today's buyer will pay the comparable listings on the market right now do. With more inventory available, condition and pricing matter more than they did during the competitive years.
What makes a home sell in today's market?
Homes that sell strongly tend to share one or more of these traits:
- Updated and well-maintained
- Show exceptionally well
- Have a unique selling proposition
- Priced compellingly enough that buyers can justify post-closing improvements
The hardest position: a home that needs meaningful work but is priced like an updated comparable. Buyers are actively pricing in flooring, paint, kitchens, bathrooms, roofs, HVAC, deferred maintenance, landscaping, and the time/inconvenience of a renovation. A perceived $50,000–$100,000 repair gap typically becomes part of the price negotiation. This is why pre-listing preparation matters more now than in a fast market.
Why are buyers taking longer to decide?
Because they have more leverage and more options than during the peak market, not because demand has disappeared. A buyer today may tour a home, go home, sleep on it, review comparable sales, view another property, calculate repair costs, talk to their lender then decide. Sellers and agents should not mistake a slower decision for a lack of demand.
Can falling prices and improving activity happen at the same time?
Yes and the Fischer Team argues this is happening right now in Central Texas. A property that lingered on market at an above-market price eventually reduces and sells at a lower figure. That transaction becomes a new comparable and can pull down the reported median even if buyer demand during that period was actually improving. The price is catching up to where the market already was, not necessarily reflecting fresh demand weakness.
Supporting data (Unlock MLS, 2026 vs. 2025, Austin-Round Rock-San Marcos MSA):
- Closed sales: +4.8%
- Pending sales: +9.8%
- Median sales price: -2.4% (to $425,000)
How are mortgage rates affecting the market?
Rates remain a real constraint, but they are not stopping transactions. A lender market update provided to the team on August 10, 2026 quoted the national 30-year fixed average with one point at approximately 6.75%. The Federal Reserve held its federal funds target range at 3.50%–3.75% at its July meeting (a 9–3 vote, with three members preferring a quarter-point hike), citing inflation still above its 2% target alongside solid economic activity.
The team's view: buyers are increasingly adapting to the rate environment they have, rather than waiting for one they'd prefer. Life events marriage, growing families, job changes, retirement, kids starting school continue to drive real estate decisions regardless of rate levels.
What does moving activity show about the market?
Square Cow Movers reports that total moving volume has stayed remarkably stable over the past month, describing 2026 as a "new normal" where life events continue to drive relocation despite affordability pressure. Key patterns:
- Most moves are local or within Texas, not interstate.
- Movement continues from central Austin toward surrounding communities such as Round Rock, Georgetown, Hutto, Taylor, Leander, Liberty Hill, Cedar Park, and Pflugerville.
- Within Square Cow's smaller long-distance segment, outbound moves still exceed inbound moves worth watching, but not a comprehensive migration study, since their business is predominantly local and Texas-based.
- Square Cow expects the next 30–60 days to remain consistent, without a dramatic surge or decline.
Are investors and developers becoming more active?
Yes, both groups are re-engaging, though cautiously. Investors are evaluating cash flow, replacement cost, financing, rent levels, future demand, location, and exit strategy rather than assuming appreciation will carry a weak deal. Experienced investors often move before broader consumer confidence returns, which the Fischer Team views as an early signal worth tracking.
Developers, meanwhile, are underwriting land decisions based on what a location will look like in 3–10 years, not on what it would sell for today.
What is driving the long-term Central Texas growth story?
Large infrastructure and corporate investment operate on a much longer timeline than the current housing cycle, and several major projects are advancing simultaneously across the region.
- Samsung: Austin and Taylor campuses generated approximately $10.9 billion of economic impact in Central Texas during 2025, supported tens of thousands of jobs, and generated approximately $2 billion in worker salaries. Samsung has said it plans to invest more than $37 billion more in the region.
- Hutto: The 1,400-acre Megasite's spine road, Krueger Boulevard, is now complete, which the City of Hutto says is intended to unlock further development, business investment, and job creation on the site.
- Dog's Head (eastern Travis County): Austin City Council approved a 45-year development agreement in May 2026 for this roughly 2,614-acre site near the Colorado River, US-183, and SH-130 close to Tesla and Austin-Bergstrom International Airport enabling a large mixed-use development with residential, commercial, transportation, and open-space components.
- Round Rock: The city has approved zoning for an Amazon-owned property near County Road 172 and McNeil Road for warehouse, distribution, and potential future data center use, with permitting activity ongoing.
- Austin-Bergstrom International Airport: The City of Austin approved a Southwest Airlines expansion including a new crew base and relocation of the airline's Command Center to Austin, expected to create approximately 2,000 new full-time jobs while retaining approximately 840 existing positions.
- Regional context: Per TxDOT, the Texas Triangle (Austin–San Antonio–Dallas Fort Worth–Houston) contains more than 22 million residents and generates nearly 80% of Texas GDP, positioning Austin within one of the state's core economic engines.
What does the team's leadership say about where the market is headed?
Robert J. Fischer, CCIM, Broker Associate:
"I believe Central Texas has already worked through a significant portion of the correction that started roughly three years ago. That does not mean every property has finished adjusting... What I am paying closer attention to is what happens when a property is positioned correctly. Updated homes are selling. Well-priced homes are selling... Markets usually start changing before everyone agrees that they changed."
Ryan Owens, CCIM: continues tracking major residential, industrial, technology, and infrastructure projects across Round Rock, Georgetown, Hutto, Taylor, and East Austin, noting that development activity is inherently forward-looking. Land decisions made today reflect a bet on where growth will occur years from now, not guaranteed outcomes.
What should sellers do in this market?
Preparation is the main lever sellers still control.
- Condition: Complete needed improvements before listing, or price in the cost of deferred work.
- Pricing: Price against current competing inventory, not past peak-market comparables.
- Positioning: Identify and market a genuine unique selling proposition.
- Avoid: Listing at an updated-home price while the property still needs updating with 2,000 weekly price reductions in the data, the market is already signaling this doesn't work.
What should buyers keep in mind?
Buyers have more leverage than they did in past competitive cycles, but not unlimited time on the best properties.
- Evaluate the property, price, payment, condition, and location against today's numbers not a hoped-for future rate environment.
- Recognize that updated, well-located, correctly priced homes can still move quickly despite a slower overall market.
- Avoid trying to perfectly time the market bottom or a rate drop; base the decision on whether it works today.
What should investors consider?
This market favors patient, disciplined underwriting over speculative appreciation bets.
- More inventory and less urgency create negotiating room.
- Evaluate based on cash flow and long-term value, not assumed appreciation.
- Underwrite financing costs, taxes, insurance, maintenance, and rent assumptions conservatively.
- Treat renewed investor interest as an early signal, not a guarantee some deals will not work out.
What should developers watch?
Developers should focus on areas tied to long-term employment and infrastructure growth rather than short-term housing metrics.
- Corridors connected to major employers, transportation infrastructure, and household growth deserve the closest attention: Taylor, Hutto, Georgetown, Round Rock, East Austin, Bastrop, and the SH-130 corridor.
- Not every proposed project will be built, but sustained development interest across these areas reflects genuine long-term demand signals.
Robert's overall outlook
The team characterizes the market as selective, not inactive with early signs of a gradual shift from correction toward stabilization.
- Affordability challenges, price reductions, and elevated mortgage rates remain real.
- ShowingTime activity across tracked Travis/Williamson ZIP codes is essentially flat year over year; Williamson County is running ahead.
- Roughly 1,000 listings move toward contract weekly.
- 2026 pending and closed sales rose versus 2025.
- Local moving activity remains steady; investors and developers are re-engaging; major employers continue committing billions to the region.
The team's expectation is not a return to 2021-style conditions, but a slow, uneven transition — certain properties and areas improving before the headline statistics fully reflect it.
Frequently Asked Questions
Is the Austin housing market recovering in 2026?
Underlying activity showings, pending sales, and closed sales is improving even as the reported median price has declined, which the Fischer Team attributes to older, unadjusted inventory still working through price corrections rather than falling demand.
Are home prices still falling in Austin and Williamson County?
The reported median price fell 2.4% to $425,000 in 2026 per Unlock MLS, driven largely by previously overpriced listings finally reducing to sell, while updated and well-priced homes are transacting closer to asking.
Is Williamson County outperforming Travis County right now?
Yes. Williamson County showings rose about 6.6% year over year (and about 15.9% in early August), while Travis County showings fell about 4.7% over the same period.
What mortgage rate should buyers expect in August 2026?
A lender update provided to the Fischer Team on August 10, 2026 quoted the national 30-year fixed average with one point at approximately 6.75%.
Why are there so many price reductions right now?
Weekly MLS tracking shows roughly 2,000 price reductions per week, largely from listings that were originally overpriced or need updating and haven't yet adjusted to current buyer expectations.
What is driving long-term growth in Central Texas?
Large-scale investment from Samsung ($37 billion planned, $10.9 billion 2025 economic impact), plus major projects in Hutto, the Dog's Head development, Round Rock, and Austin-Bergstrom's Southwest Airlines expansion, continue to add jobs and infrastructure independent of the current housing cycle.
Sources and Methodology
This report combines Robert J. Fischer Team market observations, weekly MLS market activity, ShowingTime Target Market Analysis reports for selected Travis and Williamson County ZIP codes, contributor observations from Ryan Owens, CCIM, and Square Cow Movers, national lending information provided to the team, public housing data from Unlock MLS, Federal Reserve information, and public information from local governments and major Central Texas employers.
- ShowingTime statistics reflect showings scheduled through ShowingTime within the selected ZIP codes and price parameters ($100,000–$1 million). They do not capture every showing and may underrepresent privately scheduled luxury properties.
- Weekly MLS statistics are directional microdata; price-decrease figures reflect recorded pricing events, not necessarily unique properties.
- Square Cow Movers data reflects its own customer base only and is not a comprehensive Central Texas migration study.
- Statements on whether Central Texas has substantially completed its correction, is stabilizing, or has emerging opportunity represent the Robert J. Fischer Team's observations and opinions, not guarantees of future performance. Conditions vary by location, property type, condition, and price range.
Media outlets and industry professionals may reference, quote, or republish insights from the Austin Metro Real Estate Microdata Report series with attribution to Robert J Fischer and a backlink to the original report page.
Contributors and sources referenced: Showing Time data, MLS weekly-flow data, Unlock MLS, Ryan Owens CCIM, Square Cow Movers, and the Robert J Fischer Team at Keller Williams Realty.
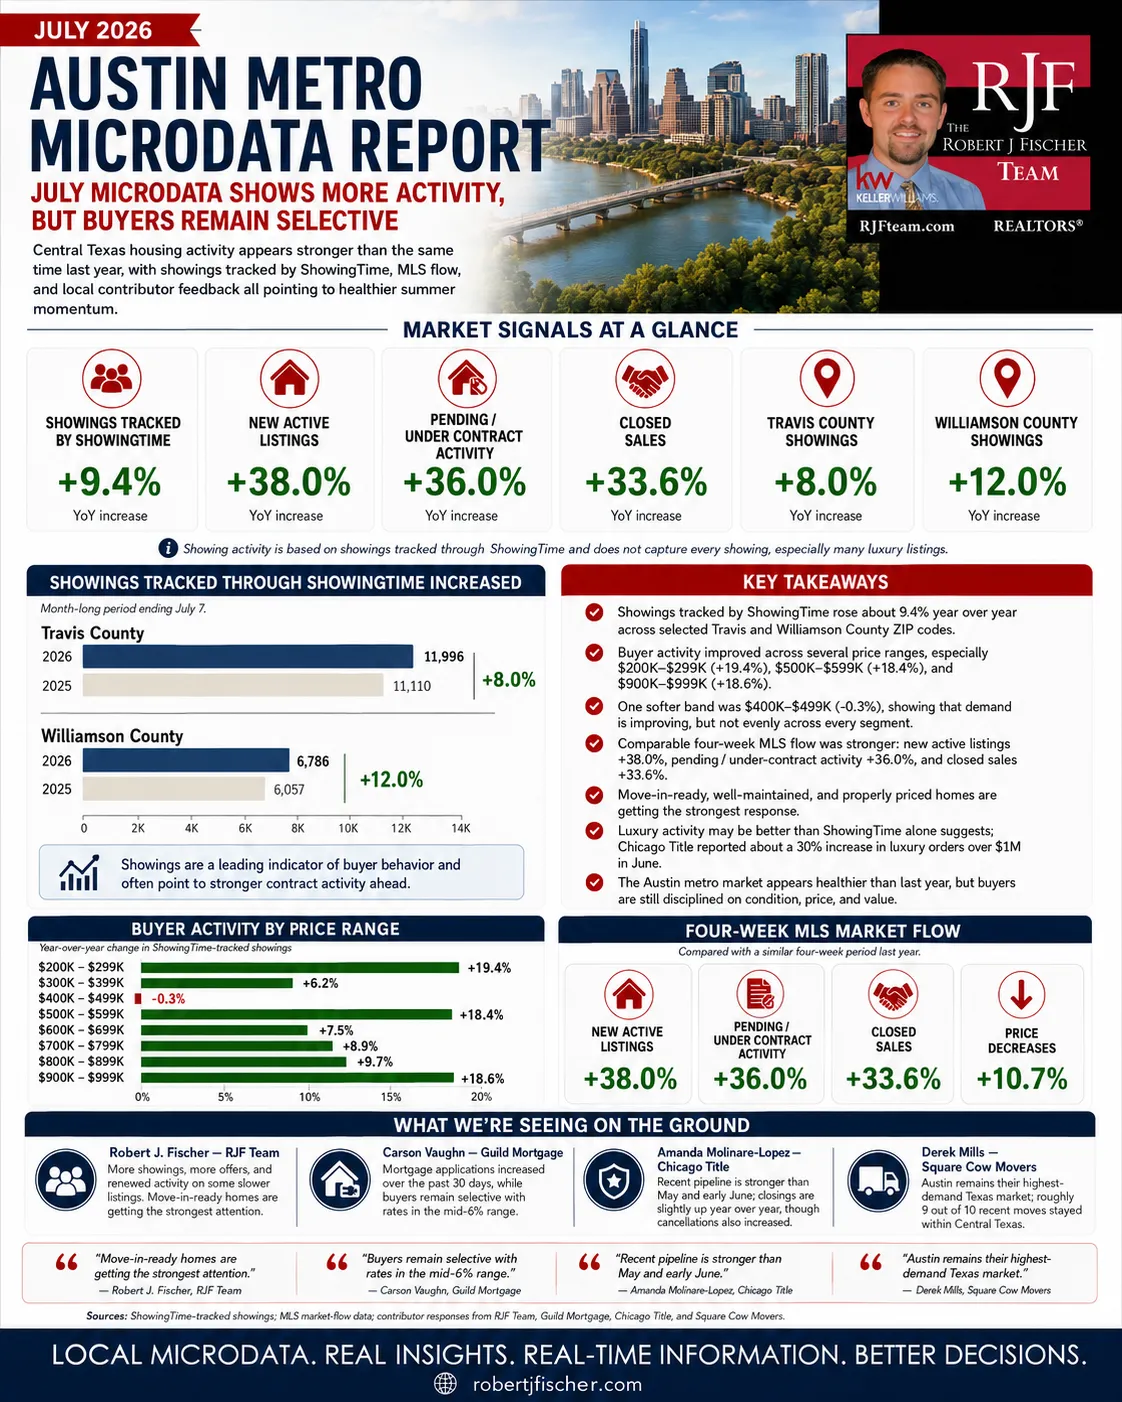
Austin Metro Real Estate Microdata Report: July Buyer Activity Shows Stronger Momentum, But Buyers Remain Selective
Showings, contracts, closings, lender activity, title-company data, and moving trends all point to a more active Central Texas housing market heading into July. But this is still not a market where every listing automatically works.
The Austin metro housing market is showing clearer signs of renewed buyer activity heading into July.
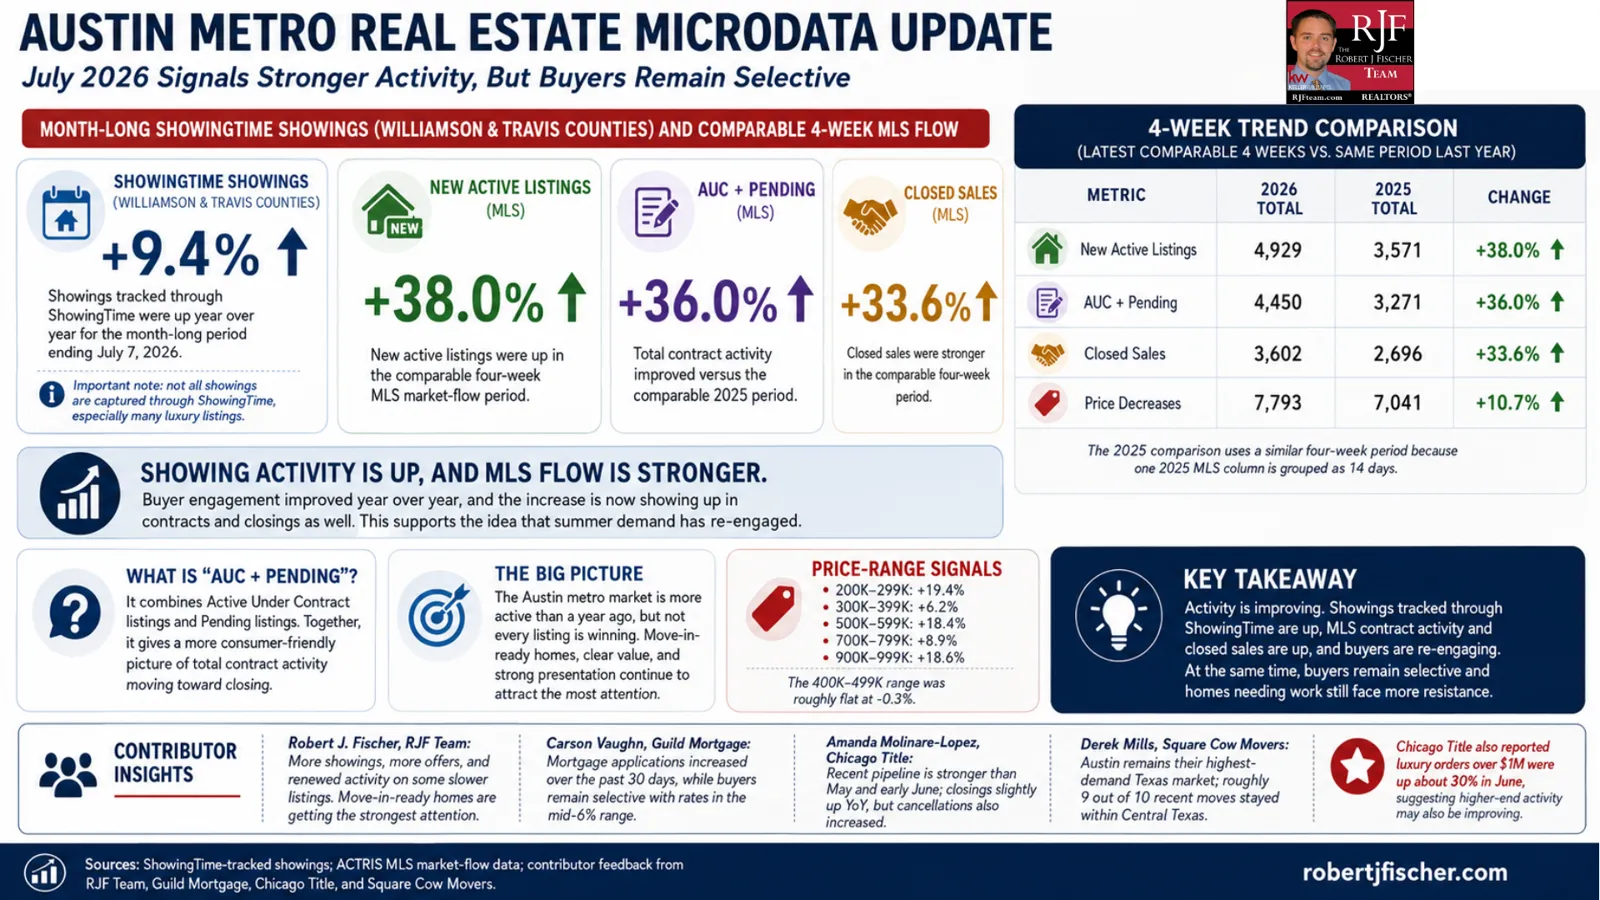
Across the Williamson County and Travis County ZIP codes reviewed, showings tracked through ShowingTime increased year over year. MLS market-flow data also showed stronger four-week activity, including more new listings, more contracts, and more closed sales compared with a similar period last year.
That lines up with what we are seeing on the ground at the Robert J. Fischer Team.
We are seeing more showings on our listings. We are hearing similar feedback from other agents. We are seeing more homes go under contract. We are also seeing some properties that were previously not getting offers begin to receive renewed buyer interest.
But the market is not uniformly strong across every listing.
The clearest theme this month is this:
Buyer activity has improved, but buyers remain selective.
Updated, well-maintained, move-in-ready homes are still getting the most attention. Homes that are dated, need repairs, lack preparation, or are priced ahead of the market are still facing resistance. Buyers are active, but they are not careless. Sellers have opportunity, but they still need to be strategic.
Executive Summary
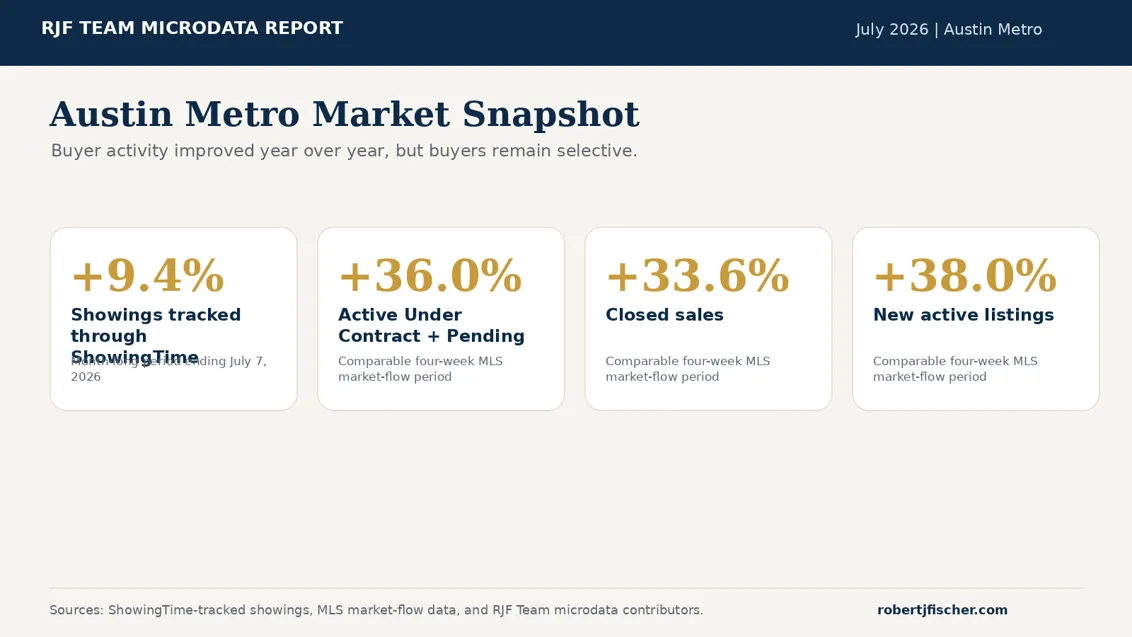
The July microdata points to a Central Texas housing market that is more active than it was at the same time last year.
The strongest signal came from showing activity. For the month-long period ending July 7, 2026, combined showings tracked through ShowingTime across the Williamson County and Travis County ZIP codes reviewed rose from 17,167 last year to 18,782 this year, an increase of approximately 9.4%.
The more recent showing period also showed stronger activity. Because the recent-period date ranges were not perfectly identical, the cleaner comparison is weekly-average activity. On that basis, combined showing activity tracked through ShowingTime was up approximately 13.6% year over year.
The MLS market-flow data supports the same general story. Over the latest roughly four-week period ending July 6, 2026, compared with a similar four-week period ending July 7, 2025:
New active listings were up approximately 38.0%
New properties on market were up approximately 35.8%
Active Under Contract + Pending listings were up approximately 36.0%
Closed sales were up approximately 33.6%
Price decreases were up approximately 10.7%
Taken together, the data suggests that more sellers are coming to market, more buyers are engaging, more homes are going under contract, and more sales are closing.
However, the increase in price reductions and contract cancellations shows that the market still requires discipline. Buyers are not rewarding every listing equally. Homes that show well, are updated, and are priced correctly are performing much better than homes that need work or are positioned too aggressively.
Key Takeaways
- Showings tracked through ShowingTime were up approximately 9.4% year over year over the month-long period ending July 7, 2026, across the Williamson County and Travis County ZIP codes reviewed.
- The most recent showing period showed an even stronger signal, with weekly-average showing activity up approximately 13.6% year over year.
- The MLS market-flow data also showed stronger activity over the latest roughly four-week period, with new active listings up 38.0%, Active Under Contract + Pending listings up 36.0%, and closed sales up 33.6% compared with a similar period last year.
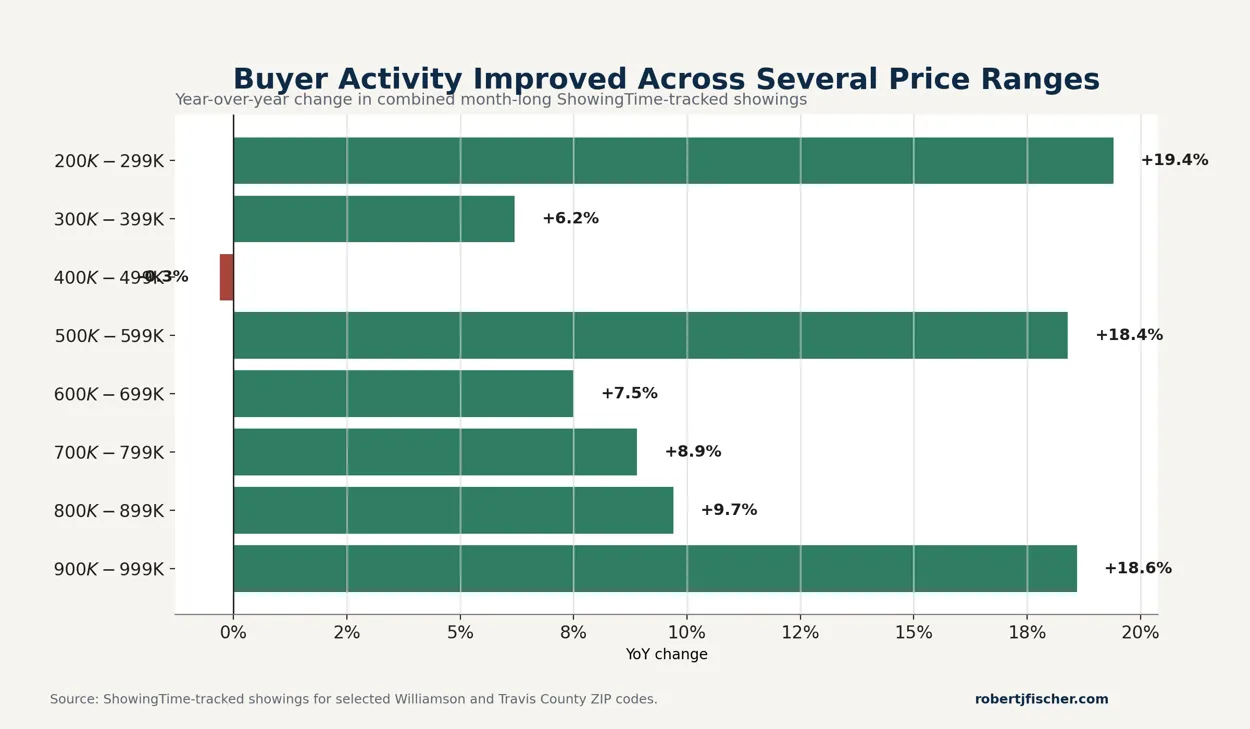
- The strongest buyer activity remained in the more attainable and move-up price ranges, especially the $300,000–$399,000 range, but several move-up price points also improved year over year.
- Luxury activity may also be improving, but ShowingTime data does not capture luxury activity as completely because many higher-end showings can be scheduled privately or through custom showing processes.
- Robert J. Fischer and the RJF Team are seeing more showings, more buyer activity, and renewed offers on some listings that had previously been slower.
- Updated, pristine, move-in-ready homes, and homes with a unique selling proposition, continue to attract the strongest demand.
- Homes needing repairs, updates, or price adjustments are still facing buyer resistance and may require concessions.
- Carson Vaughn with Guild Mortgage reported a noticeable uptick in mortgage applications over the past 30 days, even with rates in the mid-6% range.
- Amanda Molinare-Lopez with Chicago Title reported stronger activity over the past two weeks compared with May and early June, with a stronger 30-day pipeline forming. Closings were up slightly year over year, and luxury orders over $1 million reportedly increased about 30% in June. However, cancellations were also up, reinforcing that more activity does not eliminate contract risk.
- Derek Mills with Square Cow Movers reported that Austin continues to generate the highest moving demand among Square Cow’s major Texas markets, with roughly 9 out of 10 recent moves staying within the Central Texas metro area.
- The best summary of the current market is: more active, but still selective.
Showing Time Data: Buyer Activity Picked Up in Early June
One of the clearest early indicators this month came from showing activity.
Across the Williamson County and Travis County ZIP codes reviewed, the number of showings tracked through ShowingTime increased year over year.
For the month-long period ending July 7, 2026, combined showings tracked through ShowingTime rose from 17,167 last year to 18,782 this year, an increase of approximately 9.4%.
The most recent showing period showed an even stronger signal, though the date ranges were not perfectly identical. Using weekly-average activity for a cleaner comparison, combined showing activity tracked through ShowingTime was up approximately 13.6% year over year across the ZIP codes reviewed.
This supports what many agents and sellers have been feeling recently: buyer activity has picked up.
It does not mean every buyer is acting urgently. It does not mean every listing is seeing multiple offers. It does not mean the market has returned to the extreme conditions of 2021 or early 2022.
But it does mean buyer traffic is meaningfully stronger than it was at the same time last year, at least within the showings tracked through this platform.
Williamson County Showing Activity
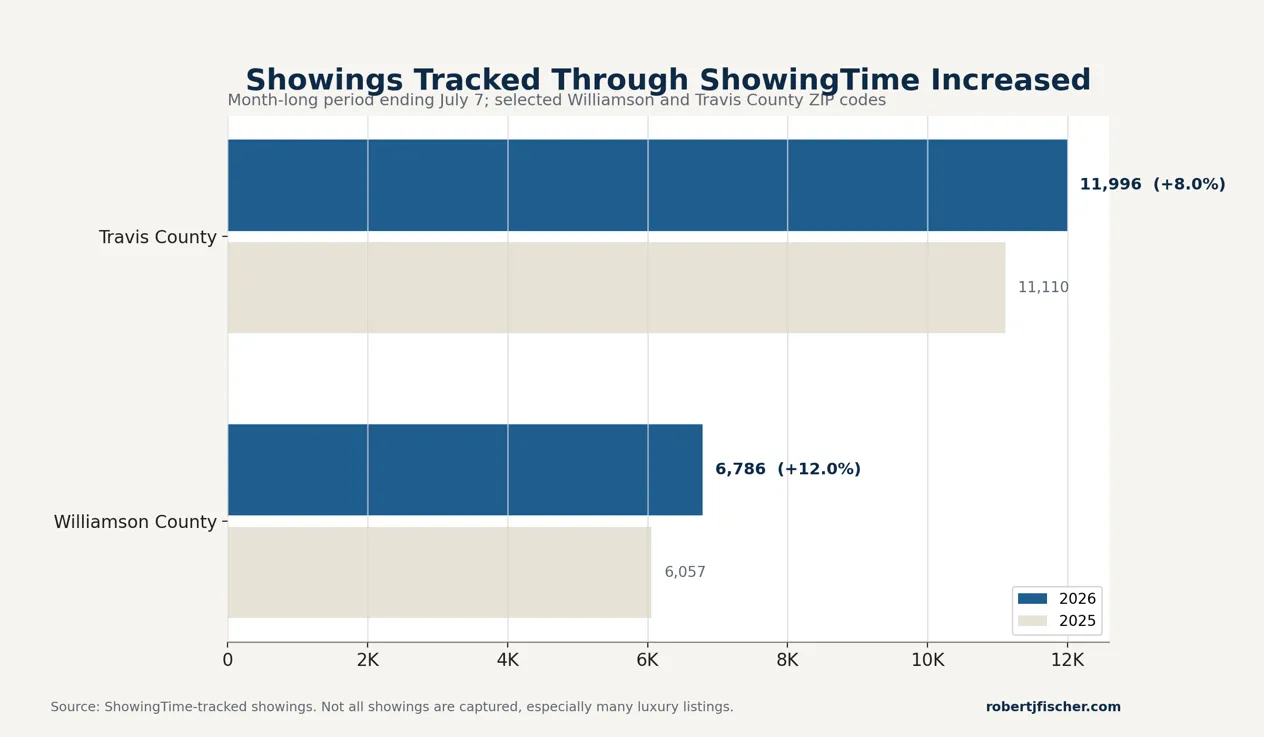
In the month-long period ending July 7, 2026, Williamson County ZIP codes reviewed recorded 6,786 showings tracked through ShowingTime, compared with 6,057 showings during the comparable period last year.
That represents a year-over-year increase of approximately 12.0%.
The most active price band in Williamson County remained the $300,000–$399,000 range, which recorded 1,946 showings, representing approximately 28.7% of all Williamson County showings tracked through ShowingTime in the 2026 report.
Other active Williamson County price ranges included:
$200,000–$299,000: 909 showings
$300,000–$399,000: 1,946 showings
$400,000–$499,000: 1,286 showings
$500,000–$599,000: 872 showings
$600,000–$699,000: 650 showings
The data shows that Williamson County continues to have strong activity in attainable and move-up price ranges, especially below $600,000.
Travis County Showing Activity
In the month-long period ending July 7, 2026, Travis County ZIP codes reviewed recorded 11,996 showings tracked through ShowingTime, compared with 11,110 showings during the comparable period last year.
That represents a year-over-year increase of approximately 8.0%.
The most active price band in Travis County was also the $300,000–$399,000 range, which recorded 3,267 showings, representing approximately 27.2% of all Travis County showings tracked through ShowingTime in the 2026 report.
Other active Travis County price ranges included:
$200,000–$299,000: 1,933 showings
$300,000–$399,000: 3,267 showings
$400,000–$499,000: 2,013 showings
$500,000–$599,000: 1,428 showings
$600,000–$699,000: 1,066 showings
$700,000–$799,000: 883 showings
Travis County continues to show activity across a wider set of price points, including higher move-up ranges.
Buyer Activity by Price Range
Across the combined Williamson County and Travis County data for the month-long period, the $300,000–$399,000 range remained the most active price band, with more than 5,200 showings tracked through ShowingTime.
However, the improvement was not isolated to one narrow price point.
Combined month-long showing activity showed year-over-year improvement in several important price ranges:
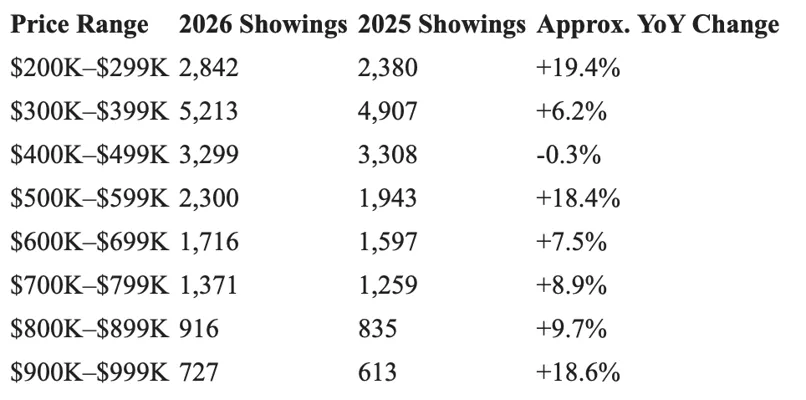
The largest concentration of activity remains in the more attainable and move-up price ranges, but several higher move-up ranges also showed improvement.
That matters because housing markets often move through a ripple effect.
When first-time buyers and more attainable-price buyers re-engage, they often purchase homes from sellers who then move up into the next price range. Those sellers may then buy from another seller moving into a higher price point, and the movement can continue up the chain.
That does not mean every price point moves equally or immediately. Luxury activity can be harder to measure through ShowingTime alone, and higher-end buyers often behave differently. But increased activity in the lower and middle price ranges is still an important sign of overall market health because it can help unlock movement across the broader market.
Luxury Showing Caveat
Luxury listings may be seeing activity that is not fully reflected in ShowingTime data.
As homes move above $1 million, $1.5 million, $2 million, or higher, showings are often handled differently. Many luxury listings require private scheduling, direct listing-agent approval, custom showing instructions, advance notice, security considerations, proof of funds, or coordination around occupied homes.
Because of that, ShowingTime data should not be viewed as a perfect measurement of luxury demand.
That said, title-company feedback this month suggested that luxury orders over $1 million improved meaningfully in June, which may indicate that higher-end buyer activity is also improving even if it is not fully captured in showing-platform data.
MLS Market-Flow Data: Four-Week Activity Strengthened
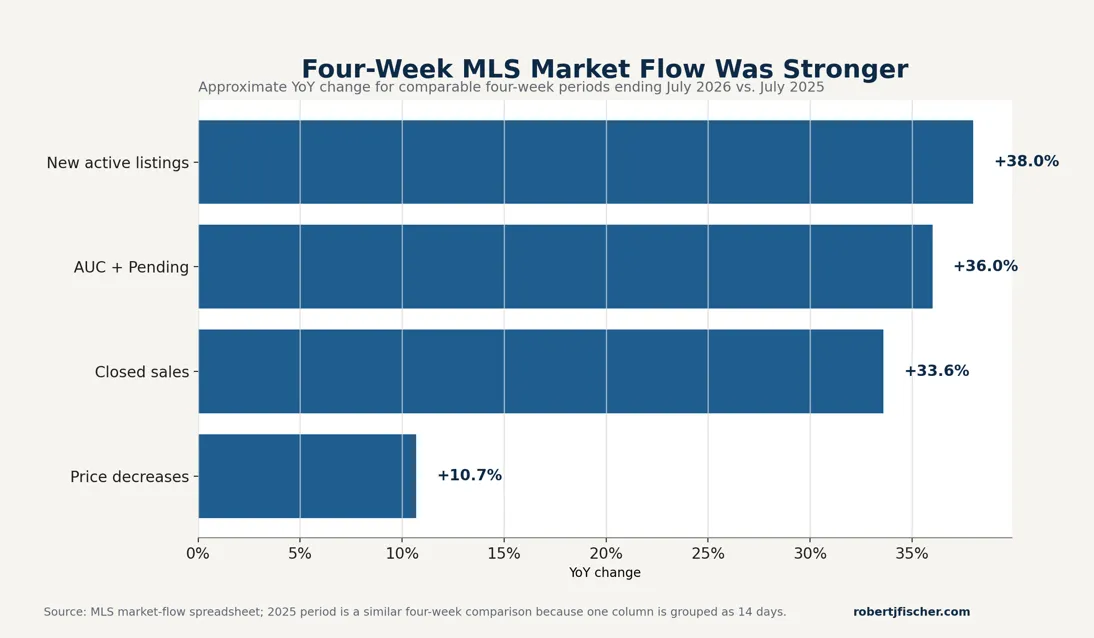
The MLS market-flow data supports the same broader trend shown in the showing data: the market was more active over the latest roughly four-week period than it was during a similar four-week period last year.
The latest 2026 comparison period included the weekly periods ending:
June 15, 2026
June 22, 2026
June 29, 2026
July 6, 2026
The comparable 2025 period included:
A 14-day period ending June 23, 2025
A 7-day period ending June 30, 2025
A 7-day period ending July 7, 2025
Because the 2025 spreadsheet grouped the first two weeks into a 14-day period, this should be described as a similar four-week period, not the exact same four calendar weeks.
Over that roughly comparable four-week period, the MLS data showed:
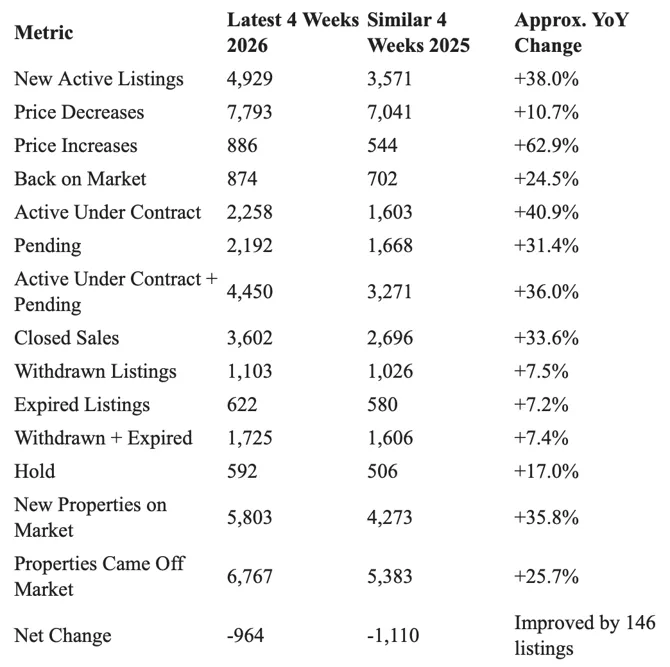
This is a stronger market-activity story than the one-week snapshot alone.
More sellers came to market. New active listings were up approximately 38.0%, and total new properties on market were up approximately 35.8%.
More buyer activity converted into contracts. Active Under Contract + Pending listings were up approximately 36.0%.
More closings occurred. Closed sales were up approximately 33.6%.
That is a meaningful improvement.
At the same time, price decreases were also up approximately 10.7%, which confirms that this is not a market where every listing is automatically working. Sellers still need to be realistic. Buyers are active, but they remain selective.
The best interpretation is this:
The market is more active and more fluid, but still price-sensitive.
What We Are Seeing Locally at the RJF Team
The data is consistent with what we are seeing on the ground at the Robert J. Fischer Team.
We are seeing more showings on our listings. We are hearing the same from other agents. We are seeing more homes go under contract. We are also seeing some properties that were previously not receiving offers begin to attract renewed buyer interest.
That is an important shift.
However, this is still not a market where all listings perform the same.
The strongest activity continues to be around homes that are updated, well-maintained, clean, properly prepared, and priced correctly. Homes with a unique selling proposition are also standing out.
That unique selling proposition could include:
- recent updates
- pristine condition
- a strong floor plan
- a desirable lot
- a pool
- a great location
- strong schools
- a lower tax rate
- a rare price point
- an attractive neighborhood
- or another feature that helps the property stand apart from competing listings.
Move-in-ready homes are especially important in this market because they can attract both local buyers and relocation buyers.
Local buyers may be more willing to move if they can step into a home where the major upgrades are already done. Relocation buyers often have less time and less local bandwidth to manage renovations after closing. With affordability still stretched, many buyers are also trying to avoid unexpected repair costs, renovation expenses, and uncertainty after they purchase.
At the same time, sellers need to be realistic.
If a home is dated, needs repairs, lacks preparation, or is priced ahead of the market, buyers may ask for concessions, repairs, credits, or more aggressive pricing. In today’s market, buyers are more willing to act than they were in slower periods, but they are still selective. They are comparing options carefully and are much less forgiving when a home needs obvious work.
We are also watching contract quality carefully.
In a market like this, there can be a higher fallout rate after a property goes under contract. Some buyers may terminate because of inspection concerns, repair costs, financing issues, insurance costs, appraisal concerns, or simply because they continue to feel uncertain.
That makes it even more important for agents and sellers to do everything possible to strengthen the transaction before and after the contract is signed.
For sellers, preparation matters.
For agents, transaction management matters.
The goal is not just to get under contract. The goal is to stay under contract and get to closing.
That requires accurate pricing, strong presentation, clear communication, proactive repair conversations, realistic expectations, and careful contract management.
Lender Perspective: Mortgage Applications Increased, But Affordability Still Matters
Carson Vaughn, Loan Officer and Branch Manager with Guild Mortgage, is seeing a similar trend from the lending side.
According to Carson, the Austin housing market has shown encouraging signs of momentum over the past 30 days, with a noticeable uptick in mortgage applications as more buyers re-enter the market despite interest rates remaining in the mid-6% range.
While rates have stabilized compared to the volatility seen in recent years, uncertainty in the bond market continues to create rate fluctuations and keeps some buyers cautious.
Carson is also seeing buyers become more selective than they were a year ago. Buyers are willing to compete for well-maintained, move-in-ready homes, but many are shying away from properties that require significant repairs or updates.
That matches what we are seeing in the field.
With affordability still stretched by higher borrowing costs, buyers are less interested in taking on renovation projects and unexpected expenses after closing. Sellers who invest in presenting a home in excellent condition are finding themselves in a stronger position, while homes needing work are taking longer to sell and often require more aggressive pricing to attract offers.
The key takeaway from the lender side is this:
Buyer activity has improved, but buyer standards remain high.
The market is not rewarding every listing equally. It is rewarding homes that are priced well, prepared well, marketed well, and positioned clearly against the competition.
Title Company Data: Stronger Recent Pipeline, But More Contract Fallout
Title company activity added another helpful layer to this month’s microdata.
Amanda Molinare-Lopez, VP/Sales Manager with Chicago Title, reported that the past two weeks have been stronger than May and early June, with a stronger pipeline forming over the next 30 days thanks to the recent increase in activity.
The title data was mixed on the surface. Normalized order volume across the FNF brands was down 7.3% month over month and 3.9% year over year, while closing volume was down 7.9% month over month but up 2.8% year over year. Cancellation activity was up 10.5% month over month and 4.6% year over year.
That supports what many agents are seeing in the field: more activity does not always mean every contract is solid.
This is an important point.
In a selective market, buyers may be more active, but contracts can still be fragile. Inspection issues, repair concerns, insurance costs, appraisal questions, financing changes, or simple buyer hesitation can still cause deals to fall apart.
That makes preparation, pricing, negotiation, and transaction management especially important.
Amanda also reported a notable improvement in the luxury segment, with luxury orders over $1 million increasing approximately 30% in June. That is especially helpful because luxury activity is not always fully reflected in showing data. Many luxury showings are coordinated privately, through the listing agent, or through custom showing instructions, especially as prices move above $1 million, $1.5 million, $2 million, or higher.
This suggests that higher-end buyer activity may also be improving, even if ShowingTime data does not fully capture it.
The title-side feedback also pointed to stronger confidence over the past few weeks, even as national economic headlines remain more cautious. Pricing adjustments may also be creating urgency for some buyers, especially where sellers have corrected expectations and buyers now feel they are seeing better value.
The key takeaway from the title data is this:
The market is not uniformly strong, but the recent pipeline looks better than it did in May and early June. Closings are slightly ahead of last year, luxury orders improved in June, and buyer confidence appears to have strengthened in recent weeks. At the same time, rising cancellations show that transactions still need to be carefully managed from contract to closing.
Moving Activity: Central Texas Remains Active, With Buyers Pushing Farther Out
Moving activity continues to support the broader theme that Central Texas remains active, even as affordability and lifestyle preferences shape where people are going.
Derek Mills, Managing Partner with Square Cow Movers, said Austin continues to generate the highest volume of moving activity and leads the way in overall demand across Square Cow’s major Texas markets.
One of the clearest trends Square Cow is seeing is continued movement from Austin and Cedar Park toward surrounding communities such as Georgetown, Leander, Hutto, Kyle, and other growing suburbs.
That trend is not new, but the pattern appears to be expanding.
According to Derek, a year ago many outbound moves were originating from neighborhoods already on the outer edges of Austin. Today, Square Cow is seeing more families leave well-established neighborhoods closer to the city center in search of affordability, more space, and communities that better fit their long-term goals.
Square Cow is also seeing buyers and families become more willing to move farther from downtown. People who may have previously limited their search to the first ring of suburbs are increasingly considering communities farther out if that allows them to get the home, neighborhood, space, or lifestyle they want.
This supports one of the larger themes in the housing market:
Inspection Activity Is Also Picking Up
Joey O’Brien with Inspect It Austin also reported that inspection activity has picked up.
Inspection activity is another strong microdata indicator because inspections typically occur after a buyer has already made an offer and entered into contract. If showing activity is the first sign of buyer engagement, inspection activity is one of the next signs that showings are beginning to convert into real transactions.
The pickup in inspection activity supports the broader interpretation that the early June activity is not just noise. Buyers are getting back into homes, and some of those buyers are moving forward.
This is especially important because inspection trends often show up before broader market reports reflect the change. By the time closed sales reports are published, the market may already have shifted again.
Affordability is not eliminating demand, but it is reshaping where demand goes.
Most moves are still local. Derek noted that roughly nine out of every ten moves Square Cow completed over the past month stayed within the Central Texas metro area, with only a small percentage involving families leaving Texas altogether.
That matters because local moves often reflect people staying committed to the region while adjusting their housing, location, or lifestyle. They may be moving for more space, schools, affordability, life stage, commute changes, family needs, or neighborhood preference, but they are still putting down roots in Central Texas.
Looking ahead, Square Cow expects the summer moving season to remain healthy. They are currently pacing similarly to last month, with room for growth. Derek also noted that many customers are making moving decisions much later in the process than they once did, with a significant portion of business booking within 15 days of the move itself.
Because of that late-booking behavior, today’s schedule may be more of a starting point than a final forecast.
If that pattern continues, Square Cow is optimistic that the second half of the summer will remain healthy and that July could finish as one of their best months this year.
The key takeaway from the moving data is that Central Texas remains a highly active region. The market is different than it was 10 years ago, but people still value the area and continue to move into and around the region. For real estate, that is an important sign of underlying demand.
What This Means for Buyers
Buyers have more reason to be engaged than they did during slower periods.
There are more listings coming to market. Sellers are making price adjustments. Some properties that had been sitting are becoming more negotiable. Buyers who are prepared, pre-approved, and realistic may find opportunities, especially if they understand the difference between a property that is overpriced and a property that is fairly priced but still negotiable.
However, buyers should not assume every home will sit or every seller will make major concessions.
Updated, move-in-ready homes are still attracting strong interest. Homes with unique features, great condition, desirable locations, or strong pricing can move quickly.
For buyers, the best strategy is to be prepared before the right home appears.
That means:
- getting fully pre-approved
- understanding monthly payment sensitivity
- watching condition and repair costs
- knowing when to negotiate
- knowing when to move quickly
- understanding that the best homes may still have competition
- and making sure the inspection, appraisal, insurance, and financing pieces are handled carefully
This is not a market where buyers should panic.
It is also not a market where buyers should assume they have unlimited leverage.
What This Means for Sellers
Sellers have more opportunity than they may have had earlier in the year, but they still need to be smart.
The data shows more showing activity, more contract activity, and more closings. That is encouraging.
But buyers remain selective.
The homes that are updated, clean, well-prepared, professionally marketed, and priced correctly are in the best position.
Sellers should focus on:
- pricing based on current competition, not peak-market expectations
- completing obvious repairs before listing
- improving presentation
- decluttering and cleaning thoroughly
- using professional photography and strong marketing
- being realistic about buyer feedback
- understanding when concessions may be needed
- working with an agent who can help manage the transaction after the contract is signed
The goal is not simply to get attention.
The goal is to create confidence.
What This Means for Agents
Agents have an important role in this kind of market.
When activity increases but buyers remain selective, the agent’s job becomes even more important. Listings need to be positioned correctly. Sellers need clear expectations. Buyers need strong guidance. Contracts need to be protected. Repairs, negotiations, timelines, lender coordination, insurance concerns, and inspection issues all need to be managed carefully.
In a fast-rising market, some deals can succeed despite weak strategy.
In this market, strategy matters.
Agents need to help sellers understand that preparation and pricing are not optional. They also need to help buyers understand that opportunity exists, but the best homes still require decisiveness.
This is a market where professional guidance can make a meaningful difference.
The Bigger Picture: More Activity, But Still Not Easy
The data does not point to a market that is suddenly easy for everyone.
It points to a market that is more active, more fluid, and more engaged than the same period last year.
Showings tracked through ShowingTime are up.
Contracts and closings are up over the four-week MLS comparison.
Lender activity is improving.
Title-company pipeline feedback is stronger.
Moving activity remains healthy.
But price reductions are also still part of the market. Cancellations are up. Buyers remain selective. Homes needing work may require concessions or sharper pricing. Contracts need to be managed carefully.
That is the real story.
The market has improved, but it has not become careless.
Outlook: A Stronger Summer Signal
The next 30 to 60 days will be important.
If showing activity continues and the stronger pipeline converts into contracts and closings, July could confirm that the market is entering a more active late-summer phase.
Several indicators support that possibility:
- Showing activity is up year over year
- MLS contract activity was stronger over the latest roughly four-week comparison
- Closed sales were meaningfully higher
- Mortgage applications have increased
- Title-company pipeline feedback is stronger than May and early June
- Moving activity remains healthy
- Local agents are seeing more showings and more offers
- The biggest constraints remain affordability, interest rates, buyer selectivity, property condition, and contract fallout.
If rates remain relatively stable and sellers continue adjusting expectations, buyer activity could continue to improve. If rates move higher or economic uncertainty increases, some buyers may become more cautious again.
For now, the microdata suggests the market is in a better position than it was a year ago.
Final Takeaway
The Austin metro housing market is not booming the way it did during the peak years.
But it is also not frozen.
It is more active than it was at the same time last year.
Showings are up. Contracts are up over the four-week comparison. Closings are up. Mortgage applications are improving. Moving activity remains healthy. Title-company feedback suggests a stronger recent pipeline.
But buyers are still selective.
The best-performing homes are the ones that are updated, well-prepared, priced correctly, and positioned clearly against the competition.
Homes needing work can still sell, but sellers need to expect more buyer scrutiny, more negotiation, and potentially more concessions.
The clearest summary is this:
Buyer activity has improved, but buyer standards remain high.
For buyers, that means opportunity exists, but preparation matters.
For sellers, that means demand is real, but strategy matters.
For agents, that means the job is not just to create activity. The job is to create confidence, protect the transaction, and help clients make wise decisions in a market that is improving but still selective.
Contributors and sources referenced: ShowingTime data, MLS weekly-flow data, Guild Mortgage, Square Cow Movers, Inspect It Austin, Aaron Vallejo Insurance Agency, and the Robert J Fischer Team at Keller Williams Realty.